Industry

Fraud and pharma inventory control tech reduces rip offs banner

Fraud and Pharma: Inventory Control Tech Reduces Rip-offs

Fraud and Pharma: Inventory Control Tech Reduces Rip-offs 700 500 Xcelpros Team

At a Glance

Making and selling fake versions of drugs for treating erectile dysfunction, high cholesterol, hypertension, cancer and other illnesses is big business.

  • $75 billion – $200 billion: The current annual revenue lost to counterfeiters
  • 13: The number of new drugs not produced in one year because of fake drugs

By the Numbers: Counterfeit Medicines

Reports by Outsourcing-pharma.com and Statista show just how much money counterfeit costs legitimate pharmaceutical manufacturers. Statista estimates the global market for fake drugs alone at $200 billion, accounting for 13 new drugs not being brought to market each year.

Other numbers of note include:

  • $100 billion – $431 billion: The estimated sales value lost to counterfeit drugs worldwide in 2020
  • 6–28: The number of new drugs not brought onto the market because of the effects of counterfeits through the impact on intellectual property rights
  • $103 billion (€92): The amount of money lost to European producers from 2012-2016 for counterfeit products including medicines
  • $19.45 billion (€16.5 billion): The amount lost to European pharmaceutical manufacturers, which was second only to clothing, footwear and accessories
  • 80,459: The number of pharmaceutical jobs affected by counterfeiters

Sources: Outsourcing-pharma.com, Statista.com

The National Crime Prevention Council has its own statistics on the cost of fake drugs:

  • 10%: The amount of all drugs in the global supply chain that are fake
  • 70%: The percentage of fake drugs in some countries
  • $75 billion: An estimate of global counterfeit drug sales from the Center for Medicine in the Public Interest quoted by the NCPC
  • 15,000: The number of illicit drug factories in India accounting for 75 percent of the world’s counterfeit drugs with other producers primarily in under-developed countries

Spotting a Fake

The Food and Drug Administration protects consumers from counterfeit medicines. “Drug safety and quality no longer begin or end at our border. The U.S. government works with foreign regulatory counterparts when possible to disrupt or close illegal operations involving the production and distribution of counterfeits,” the FDA states.

Figure: 1Identifying counterfeit medicine

Spotting a Fake pharma product

Identifying counterfeit medicine:

  • Packaging different that expected
  • New or unusual side effects
  • Medicine is available for purchase online

Resellers can protect themselves and their customers by only buying from authorized and licensed companies.

Resellers should also read the packaging. Potential fake products from unlicensed sources can be misbranded, adulterated, contaminated, improperly stored and transported, ineffective or unsafe, the FDA states. Some counterfeits have been spotted without a National Drug Code (NDC) number. Others have misspelled labels.

Among the medicines reportedly being copied and sold in the U.S. during the last five years are:

  • Symtuza ® from Janssen Pharmaceuticals (Dec. 24, 2020), used in the treatment of HIV
  • BiCNU ®, a cancer-fighting drug from Emcure Pharmaceuticals, Ltd.
  • Botox ® from Allergan
  • Cialis ® from Eli Lilly

Dangers of Using Counterfeit Drugs

Counterfeit drugs affect more than just legitimate companies: they harm people using them. Citing a 2017 World Health Organization (WHO) study, the OECD iLibrary states the effects on individuals of counterfeit medicines include:

  • Adverse—and possibly toxic—effects from incorrect active pharmaceutical ingredients
  • Ineffectiveness by not treating the targeted disease
  • Loss of confidence in health care professionals and health systems
  • Lost income by users from extended illness or death

The OECD report also referenced a 2019 Novartis in Society Report. Forensic tests of counterfeit medicine samples showing patients could be harmed by 90 percent of the counterfeits.

Fighting Counterfeit Drugs

Pfizer, one of the world’s largest drug manufacturers, supports the international “Fight the Fakes” campaign raising awareness of the dangers from using counterfeit medicines. Pfizer states that counterfeit versions of 105 Pfizer products were found in 113 countries. The company works with law enforcement agencies, wholesalers, pharmacies and others to increase inspection coverage, monitor distribution channels and use other methods to fight back.

One way pharmaceutical companies are fighting back is through the Drug Supply Chain Security Act (DSCSA). Enacted in 2013, the act requires manufacturers, contract manufacturers, repackagers, wholesale distributors and other meet compliance requirements.

A large part of this involves labeling.

For example, a warehouse receiving clerk can print labels after receiving raw materials but before putting them away.

Using Wave label printing, labels are available before workers run the work order on a mobile device. Workers then attach the labels during picking instead of after picking. Label printing options include:

  • According to the number of cartons on a single work line
  • With different sequences such as carton and pallet labels
  • Creating a unique serial shipping container code (SSCC) for each carton and including it on the label
  • Creating globally usable GS1-compliant numbers for bills of lading and SSCCs

Using Labels to Combat Counterfeiting

Among the labeling and packaging methods used to fight counterfeiting are holograms, 2-D barcodes, radio frequency identification tags (RFID) and packaging features that are either visible (overt) or hidden (covert).

NeuroTags, which makes these types of tags, states that it is easy for counterfeiters to make simple holograms and copy legitimate images. Luminescent topcoats revealing patterns and colors under special lighting are difficult to imitate, making it a good anti-counterfeiting solution for pharmaceutical products.

Smart Labels—also known as Smart Tags—have an RFID tag with a computer chip, antenna and bonding wires under a conventionally-printed barcode label. Among their benefits for the pharmaceutical industry —beyond being difficult to copy—is their ability to track temperatures. This is critical for some medications, such as the current Covid-19 vaccines from companies such as Pfizer and Moderna.

Another benefit of smart label technology is letting companies track items in real time. “It fulfills the requirement of tracking objects remotely, effectively, and most importantly at an affordable price,” Packaging Strategies.com states.

Combined with Microsoft Dynamics 365 Supply Chain Management, these types of labels make it difficult for counterfeiters to substitute cheap, ineffective and dangerous knock-offs for real medications.

D365 Supply Chain Management functions let companies track products from the moment raw materials arrive in the warehouse, through the production process and on to the sales floor.

Customers with equipment required to read the labels—and personnel trained in what to look for—will be able to distinguish legitimate goods from the fakes.

Summary

Counterfeiting pharmaceuticals costs the industry billions every year. It affects not only sales profits but intellectual property rights. Combining different types of labels such as Smart Tags with inventory tracking software lets pharmaceutical manufacturers know when real goods arrive at their destinations. It also lets them know when someone along the supply chain stole their products and replaced them with fakes.

Get a consultation to learn about pharmaceutical industry fraud.

Schedule Call

Standard costing in pharmaceutical manufacturing banner

Standard Costing in Pharmaceutical Manufacturing : Industry Challenges & Solutions

Standard Costing in Pharmaceutical Manufacturing : Industry Challenges & Solutions 700 500 Xcelpros Team

At a Glance

Costing methods for pharmaceutical manufacturing, especially the standard cost method, can significantly help reduce hidden costs.

  • On average, 30% of costs go undetected due to poor business practices and the inability to detect them.
  • Improper habits of recording data can be a major culprit in accumulated hidden costs.
  • The Standard Cost Method provides a simpler solution, offering insights into daily cost, cost variance and profitability analysis for pharmaceutical manufacturing companies.

Introduction

Forecasters are projecting more opportunities for mid-market pharmaceutical companies operating in the US. These opportunities will require more streamlined processes within pharmaceutical manufacturing and contract development and manufacturing organizations (CMOs and CDMOs). The most recent projections included the following:

  • The global medicine market is expected to top $1.4 trillion by the end of 2021, Grand View Research states. Anticipated spending on medicine in the U.S. alone is expected to grow to $655 billion at a rate of 4% – 7% by 2023. followed by pharmerging countries —emerging nations in areas such as Africa and parts of Asia—hitting $385 billion (5% – 8% compound annual growth rate) and the top five European countries at $225 billion (1% – 4%). Japan will either lose 3% or stay even, a report from the IQVIA Institute for Human Data Science notes.
  • Rising research and development (R&D) costs are being accompanied by more stringent testing requirements.
  • American companies introduced 138 new chemical or biological entities (NCEs and NBEs) between 2016-2020, according to Statisa.com. Europe produced 64, Japan released 38 and the rest of the world generated 48 for a total of 288 during that span. This compares to 226 from 2011-2015 and 146 a decade earlier, IFPMA states.

Figure: 1Global Pharmaceutical Market sales in 2019

Global Pharmaceutical Market sales in 2019

Change Accounting Methods

Adapting to these changing market dynamics requires changes in accounting across the pharmaceutical industry. Companies will need to become more sophisticated when it comes to their methods of costing, profitability analysis and production variance calculation and reporting.

A few ways to achieve these goals include standard costing methods, following best practices and optimization within a pharmaceutical batch manufacturing company. Also fairly critical in today’s highly-regulated environment will be much more accurate reporting of data.

The Never-Ending Challenges of C-Level Reporting

Determining the overall profitability for a product is a major concern for any C-Level executive. Calculating cost structure in the pharmaceutical industry is especially tough to determine when it involves fast-moving raw materials, labor, overheads and other indirect costs.

For pharmaceutical companies, one prime objective is following standard operating procedures (SOPs) in adherence with the FDA’s compliance reporting rules. In the past, companies have placed so much focus on staying compliant it becomes easy to lose sight of key indicators that drive profitability and organizational goals.

In continuous production and batch manufacturing processes, the multitude of activities involved requires costing for each activity. This can be tough as many moving parts make it hard to identify the right cost breakdown structure. Despite the difficulties, companies must measure true costs for stakeholder reporting.

True costs vary from those assigned by traditional cost-accounting methods by 30 to 100 percent.Source: -Per McKinsey

What matters to the CFO?

CFOs don’t look at a single product or product line. Instead, they often prefer a much broader view when determining what matters the most, like the details needed to determine actual costs and how any variances came to be.

Since the manufacturing process is so heavily intertwined with product costing, the need to highlight different elements that aid in standard cost determination and variance reporting becomes even greater. Some reporting structures use backflush costing methods to delay costing until an item is manufactured. This can be a reporting nightmare when it comes to analytics and production performance metrics.

It’s common for some people to analyze these costs and variances using things like Microsoft Excel spreadsheets with complex macros and v-lookups. Analyzing true costs this way is extremely challenging, especially when your system doesn’t keep track of perpetual costs until the completion of a production job.

Data Capture Discipline and Lost Visibility

Longer production campaigns in continuous processing can have individual processes taking days, weeks or sometimes months. Recording actual numbers based on material and resource consumption to report standards compared to actuals becomes tedious. Enforcing process discipline is one way to help streamline this part of the job.

Gaining clarity and determining actual costs can take hours of data crunching, the process becomes harder and more complex when you take into account any reworked batches or lots. All the different moving parts of reworked jobs can make it tough to determine the additional cost of starting materials, line clearance, labor and machine hours that get compounded to the original batch cost.

Human capital, machine or work center hours need to be planned across multiple production jobs. Proper planning helps accurately source and schedule labor while allocating machines to each production run.

5%

High-performance pharmaceutical companies have about 3% of rework products when compared to the average companies that have about 8%

Source: -Per McKinsey

People and Processes Impact Costs and Profitability

A large amount of time and resources are spent trying to recover inefficiencies caused by following improper procedures in day-to-day operations. These inefficiencies may be due to the lack of any properly identified key performance indicators (KPIs), processes or methods to track efficiencies.

Understanding the total cost of each batch helps proactively plan for producing other similar “A” grade items. The Production Planner cares less about cost and more about capacity roadblocks. They want to know how additional material and resource requirements could lead to unplanned downtimes.

Warehouse operators need to record consumption. Their figures are based on when Quality Control (QC) tells them to proceed with the job, how much to consume on the batch and how many hours were already recorded. CEOs want to know if the operators have systems and processes in place to capture critical data in real-time.

Many equipment operators tend not to record data during operations, waiting instead till the end of the production run to capture any data.

Production managers constantly look for ways to substitute materials to meet timelines, quality standards and batch potency, all while following existing company rules. At the same time, they need to accurately record batch data. Using Internet of Things (IoT) sensors that capture this data as it occurs in real-time and feed it directly into the ERP system provides this accurate, continuous data flow.

Batch Manufacturing – An Example

Some long-running batch manufacturing processes require hourly quality control tests. Depending on the PH values and other data, operators add chemicals and make other changes to achieve the desired results. From a cost accounting perspective, the quantity of materials consumed from inventory may not be recorded. This causes inventory records to become out of sync and inaccurate. Not knowing what and how much is used may cause a controller to categorize these additions as overhead costs.

Some practical solutions to ensure materials added during ongoing production testing are accurately recorded include:

  • Having an industrial grade tablet or mobile device on the shopfloor to aid in data capture. Products and quantities are captured when operators have the time to input them.
  • A more accurate method uses IoT sensors that tracks starts, stops and inputs within each tank. IoT sensors can also generate an alarm when deviations occur.
  • Barcode readers and scanners are also helpful in capturing product use data on the shopfloor, and can be easy to operate.
  • Training staff on simple new production processes helps ensure every team is performing the right task at the right time.

Tracking electronic signatures helps ensure the right people are performing each process and can help prevent incorrect practices.

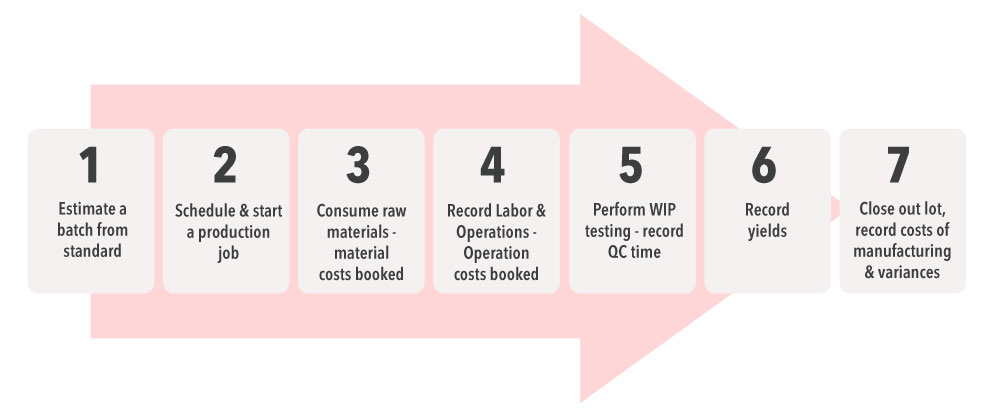
High-Level Production Process

High-Level Production Process

Standard Cost Calculation

How are standard costs determined in a sophisticated mixed-mode manufacturing ERP system, where process manufacturing and discrete processes occur within the same operation facility? These costs are derived from standards set on the formula or build of materials (BOM) depending on a combination of the:

  • Batch being manufactured
  • Contents of each container
  • Hours spent on each operation
  • Standard resource costs per unit price

The calculated cost of materials using a formula or a BOM is derived from individual raw materials or intermediate costs. The cost of operations comes from resources and machines assigned to the task.

Past history helps set accurate standards to proactively manage production runs and accurately record production costs.

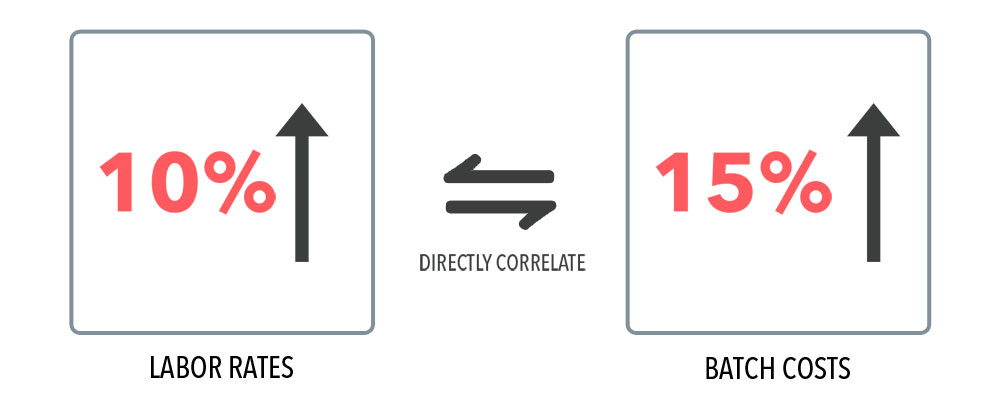
C-level executives tracking profitability and plant managers whose bonuses depend on higher margins are constantly looking to reduce redundant spending caused by operational and resource inefficiencies.

Figure: 2Standard Costing Formula

Standard Cost Calculation

Standard Cost Calculation Results

What Should Happen When Estimating Production Costs

The first step in estimating production costs is planning the size of each batch. Your ERP system should automatically scale from the standard batch size and identify the standard cost. Using the ERP data provides an insight on other decisions about the batch such as identifying the right margin and setting an appropriate selling price. These figures can appear on customer quotes and sales orders.

As production jobs are released to the production floor, operators allocate all appropriate raw materials for consumption. When this happens, a good inventory tracking system such as that in Microsoft Dynamics 365, marks those specific raw material lots as unavailable for other batches.

Allocating raw material lots and resources correctly and timely recording data in a modern Pharmaceutical ERP has benefits. They include controlling unnecessary mistakes and coverups, providing a true picture of product costs.

Standard Cost Rollup

The standard cost rollup for a manufactured product is made up of direct material, direct labor, overhead and indirect costs.

Following actual raw material consumption, there is a tendency to not record point-in-time information for fear of making mistakes or making errors while not tracking what was altered from standards and causing a variance.

The Consumption Process

During raw material consumption, physical inventory is relieved by directly booking material costs to Work-In-Process (WIP). If we were to assume that the only changes on a production run is to the overall labor and machine time on operations, then all standards relieved from WIP would book production and quantity variances based on standard.

raw material consumption Process

Using a Multi-Tier Formula or BOM

A more complicated scenario occurs when there is a multi-tier formula. The production produces intermediate products that are then used in the next tier. Additional raw materials are added. This process continues until the product is finished, in some situations, yields are tallied before moving to the next step.

In others, the shop floor goes by standards, recording adjustments to materials and operations after the final finished lot is produced. In this scenario, all tiers in the multi-tiered process are only closed at the end. This process can cause a complicated cost calculation considering all the elements involved plus any variances.

Multi-Tier Formula or BOM for Production Process

Key Takeaways

With proper record keeping and accounting methods, it’s possible to streamline operations and reduce or eliminate unpredictable variances. If you’re not sure where to start, these three steps will help.

  1. 1.Examine your current manufacturing practices and calculate their downstream impact on costing.
  2. 2.Understand how competitors outperforming the market are becoming more efficient.
  3. 3.Identify different methods to improve both productivity and worker efficiency.

Organizations can take advantage of ERPs like Microsoft Dynamics 365 to help pinpoint areas for improvement and focus on company goals. It includes production cost buckets including quantity, substitution and lot variances.

Contact Xcelpros to learn more. Xcelpros loves to show customers how they stand to benefit from the sophisticated analytics and business intelligence tools embedded within D365’s Finance and Supply Chain Management systems. These tools provide the necessary insights to grow and stay ahead of the market.

Get a Consultation to learn how to improve standard costing in pharmaceutical manufacturing.

Get Started

References: Pharmaceutical manufacturing market