Manufacturing

Helping your company fit into the-bio-economy banner

Helping Your Company Fit into the Bioeconomy

Helping Your Company Fit into the Bioeconomy 700 500 Xcelpros Team

Introduction

The term “bioeconomy” has begun gaining steam but many executives don’t know what it means or how it might affect their business.

Brain-biotech.com defines bioeconomy as producing renewable biological resources and then converting them plus waste streams into valued-added products. These include food, animal feed, bio-based products and energy, including fuels.

A related but different concept is the circular economy, “where the value of products, materials and resources is maintained in the economy for as long as possible, and the generation of waste minimized,” the article states.

Both concepts share the goals of increasing resource efficiency and lowering demand for new petroleum resources while creating more jobs. Tying into both of these is “cascading,” which promotes recycling and remanufacturing. An example of cascading is using fresh wood to build furniture. When the main product’s life ends, part or all of the wood is used for something else such as a different piece of furniture or a planter.

“The circular economy includes all kinds of material streams with different utilization routes. Organic recycling, which equals biodegradation, and even the capture and utilization of carbon dioxide from industrial processes or the atmosphere are included,” the report states.

One way the bioeconomy affects industry is by producing renewable carbon compared to fossil carbon such as oil and other fossil fuels. The bioeconomy and circular economy have a common goal: creating a more sustainable world with a low carbon footprint. Both avoid using fossil carbon. Using sustainable resources helps achieve climate targets, brain-biotech states.

Among the stated goals of the bioeconomy and the circular economy are:

  • Reducing the use of fossil fuels
  • Wiser management of natural resources
  • Continually reusing minerals, metals, and biomass from agriculture, forests and the seas
  • Creating biodegradable and compostable products
  • Generating ways to capture and reuse carbon dioxide in the Carbon Capture and Utilization (CCU) process
  • Reducing greenhouse gas emissions such as carbon dioxide (CO2)
  • Reducing waste, especially anything going into landfills
  • Promoting research across disciplines and borders
  • Creating more jobs in rural and urban environments

Impacts of the Bioeconomy on the Financial Economy

Features unique to the bioeconomy include creating new products and better utilization of agriculture and forestry, Brain-biotech states. Among its examples are using genome editing to create products with lower toxicity and new functions plus more nature-compatible (i.e., biodegradable) and healthier consumer goods.

So where can we see the bioeconomy? “The U.S. bioeconomy is all around us: new drugs and diagnostics for improved human health, higher-yielding food crops, emerging biofuels to reduce dependence on oil and biobased chemical intermediaries,” the 2012 White House’s National Bioeconomy Blueprint is quoted as saying in youmatter.world.

Youmatter.world connects the bioeconomy and circular economy by referring to the circular economy as “the what” as in what are desired outcomes. The bioeconomy is “the how” as in how biophysical processes can be enhanced to achieve the expected result.

Transforming the U.S. economy from one based on hydrocarbons (i.e., fossil fuels) to a bioeconomy, will have the most dramatic effects. These effects will be felt most strongly in the energy, agricultural, chemical, industrial and consumer products and transportation industries, attorney Neil Belson wrote in 2016.

Among Belson’s conclusions are, “an economy that runs primarily on renewable, domestically produced bio based raw materials is inherently less vulnerable to disruption than one which relies on or is heavily influenced by the availability of foreign fossil fuel energy supplies.”

Among the biofuel resources are corn stalks and wheat straw, animal manure, household and industrial organic wastes containing carbon and dedicated fast-growing energy crops.

Belson also suggests a major target of opportunity is the $164 billion U.S. organic chemical industry.

By the Numbers

After several years of declining revenue caused by low fossil fuel prices, the Organic Chemical Industry is expected to resume growing in 2021, reports from IBISWorld state. Among the highlights are:

  • 13.2%: The 2021 increase in market size estimated by the Organic Chemical Manufacturing Industry (OCMI).
  • $106 billion: The 2021 market size measured by revenue of the OCMI
  • 1,107: Number of organic chemical businesses in the US
  • 75,441: Number of people employed in the organic chemical businesses in the US

Current top products and related manufacturing activities are producing:

  • Ethyl alcohol
  • Cyclic crudes, coal tar, wood chemical and intermediate products
  • Basic organic chemical products
  • Fatty acids
  • Synthetic organic alcohols
  • Synthetic flavor and perfume materials
  • Bulk pesticides

This list does not include forestry-related materials such as major wood products.

According to the Government

The US Department of Agriculture released the 128-page “An Economic Impact Analysis of the U.S. Biobased Products Industry” in 2015.

Using 2013 numbers, the US Biobased Products Industry:

  • Contributed 4 million jobs
  • Added $369 billion to the U.S. economy
  • Created 1.64 more jobs for every 1 biobased products job
  • 20,000 products in the BioPreferred program database not including traditional textile fabrics or forest products. The true number is closer to 40,000, the report states.
  • 300 million gallons of petroleum replaced by biochemicals and natural-based products replacing petroleum products such as Styrofoam.

Get a consultation to learn how to get your company ready for the bioeconomy.

Get Started

Areas of Opportunity

Figure: 1Number of Installed Ethanol Biorefineries in the US

Number of Installed Ethanol biorefineries in the US

Statista states that in 2019, the US had more than 200 ethanol biorefineries. In 2015, the USDA listed 213 such refineries. Audi, BMW, Porsche and Volkswagen make diesel vehicles that can use biodiesel blends, edmunds.com states. As of 2014, most biofuel came from soybean oil. The US Department of Energy states that the B20 biodiesel blend contains 2% – 6% biodiesel mixed with petroleum fuel.

Adding biodiesel improves fuel lubricity making vehicles easier to start and reduces ignition delay. It also reduces premature wear on moving parts even in concentrations as low as 1%, the Alternative Fuels Data Center states.

Chemical and pharmaceutical companies, take note: Modor Intelligence estimates the market for biochemical reagents will grow at a CAGR rate of 9.1% between 2020 – 2025. This market is defined by products such as cell and tissue reagents, electrophoresis and others plus geography. Asia Pacific is the fastest growing market while North America is the largest.

Chromatography reagents have the greatest demand with their use in many pharmaceutical processes such as separating chemicals and biomolecules, diagnostics and protein purification.

Market Research Future’s report on the Global Bio-Based Chemicals Market states the top products between 2019 – 2025 will be bioplastics, bio-lubricants, bio-solvents, bio-based acids, bio-surfactants, bio-alcohols and others.

Let Technology Help

What chemical wastes currently costing the company money to be shipped to a landfill can be reused to boost profits? Companies using technology like Microsoft PowerBi and Microsoft Dynamics 365 to organize their data can organize waste into its core components. Some of it might be easily converted into biofuels. Others might be broken apart with components becoming biodegradable solvents.

Another way tech can help is by looking at existing customers in growing markets and suppliers in areas where key crops are grown. Are they ways to piggyback shipments and reduce transportation costs while also cutting air pollution? Microsoft Dynamics 365 Supply Chain Management can combine and crunch data. While helping a business run much more efficiently, it can also offer insights into new ways to use existing products.

The Bottom Line

The bioeconomy is here to stay, as is global warming. Companies entering bioeconomy markets should look at new ways to use plant-based materials to replace petroleum products, like the chemical and pharmaceutical industries using plant-based solvents to develop new medicines because they are less toxic and better for everyone in the long run.

Alternate fuels, fibers, chemicals made from plants and other biological sources are just a few of the many potential products whose demand will continue to rise.

Using cutting-edge enterprise resource planning software can help a company more accurately evaluate its own products and resources. Who knows, there just might be the materials to build some bioeconomy products already sitting on a warehouse shelf. With the right tech, you will know what you have.

Overview of Chemical Distribution in Microsoft Dynamics 365

An Overview of Chemical Distribution in Microsoft Dynamics 365

An Overview of Chemical Distribution in Microsoft Dynamics 365 700 500 Xcelpros Team

At a Glance

Chemical distribution companies have several requirements when facing challenges in today’s business world. They include:

  • Needing an overview of end-to-end supply chain processes including solutions to increase operational efficiencies
  • Getting an overview of planning and inventory management for bulk chemicals and packaged chemicals
  • Understanding best practice depictions of typical chemical distribution processes

By the Numbers

Chemical distribution companies today are focusing their efforts on optimizing supply chains, warehouse and floor operations. They function as a supply chain partner, anticipating customer needs and helping them stay ahead of their competition.

  • The chemical distribution industry is on a massive growth curve. Grand View Research states the industry’s value was $247.1 billion in 2020.
  • The expected compound annual growth rate from 2020 -2028 is 4.0 percent.
  • There’s a growing need to set your processes straight and streamline your supply chain with sufficient controls in place to keep up with the pace of the market.

4 Key Processes

There are 4 key processes that matter to a chemical distribution company:

  1. 1.Order-to-Cash: The ability to take a customer order efficiently and deliver it by the customer’s deadline.
  2. 2.Procure-to-Pay: The ability to manage purchase orders and receiving departments efficiently, optimizing spending on procurement to avoid high capital inventory spending.
  3. 3.Inventory Management: Inventory Management: Maintaining optimal inventory levels without excessive capital spending.
  4. 4.Break Bulk Operations: Break Bulk Operations: Breaking down bulk shipments such as tankers and large shipments of individual products into smaller pack sizes.

User Story: Warehouse Chaos

Survival in a highly competitive world requires chemical distribution companies to efficiently organize and design their warehouses. Internal routes must be optimized to let manned and robotic pickers grab inventory for break bulking, repacking or outbound shipments. Inventory storage needs to be precisely planned, especially while handling hazardous chemicals.

Too familiar is the chemical customer with multiple warehouses. They store bulk and packaged chemicals stocked in rows, racks and bins spread across multiple aisles. Some of these chemicals require temperature controls. Many have hazardous condition restrictions.

It’s common for companies to focus on meeting the basics and storing things wherever they fit. No warehouses are organized, making it difficult to track where incoming product was stored and gathering items to fill customer orders.

Making matters worse are poor operational practices. For example a high volume order involved taking some contents from a 55 gallon bulk chemical drum. Operators move the drum to Staging, remove what order the order required and then leave the drum at staging. No effort is made to record the location or remaining quantity. At best, inventory numbers are manually written on a tag attached to the drum, not entered into the computer system.

This method creates many inefficiencies later in the production process. They include:

  1. 1. Inefficient use of space. The Staging area was already small. It was made worse by leaving drums and totes for break-bulk orders, causing Staging to grow continually.
  2. 2. Inefficient use of time. The system showed the drums were at their primary inventory location. Operators unable to find items there had to manually check each tag. Some operators eventually knew to look for inventory in the primary or staging locations. Other workers wasted time looking for the items.
  3. 3. No inventory tracking method.
  4. 4. Inaccurate inventory counts. Inventories were constantly adjusted for missing or untraceable inventory. Lack of accurate counts meant ordering more supplies to fulfill customer demands.
  5. 5. Over ordering meant not having enough space to store the extra bulk material.

The chaos caused by not returning bulk items to their designated location can make conducting a physical count a Herculean task. With missing inventory placed at unplanned staging locations, it added to the warehouse imbalances.

An Ideal Journey

Organizing any operation-chemical manufacturing or distribution—starts with analyzing its operations, growth initiatives and business goals for the next five years.

Ways to make warehouses more efficient include:

  • Review existing warehouse storage and design in terms of locations and inventory groupings.
  • Using federal, state and local safety guidelines based on chemical properties, create procedures stating where chemicals must be stored.
  • Number locations by aisle, row, rack and bins.
  • Place the fasting moving items close to the shipping area.
  • When receiving bulk containers, label them with a scannable barcode.
  • Label the put away locations and staging locations so checkers can quickly and easily count quantities in a specific location.
  • Provide workers with mobile devices that let them scan barcodes providing real time work details and order status updates.

Processes and Procedures in the Chemical Industry

Chemical manufacturing and distribution companies have many similarities in terms of receiving, inventory, planning, shipping and warehouse management.

The basic processes within the chemical distribution industry are centered more around warehouse management, inventory, planning, repacking, light manufacturing, shipping and receiving. Chemical manufacturing adds route operations, resources and work in progress (WIP) testing.

Inventory management processes in a chemical distribution company start with Purchasing and Receiving.

Purchased products are bulk or packaged chemicals, packaging items, labels and other supplies. These products normally come from an approved primary vendor or supplier.

Reporting and analytics shows two statistics that determine the effectiveness of the primary supplier:

  1. 1. The buyer’s decision to switch to an alternate vendor for a specific purchase.
  2. 2. The number of times this change occurs.

Vendor ratings showing the percentage of purchases delivered on time and in full is also important to buyers.

Figure: 1High-level Flow of Purchase Order-to-receive Process

High level flow of purchase to receive process

The next major process is inventory and warehouse management.

The most efficient warehouses are organized by aisle, row, rack, bin, lot or batch. They have pallet ID tags and box IDs. Materials managers seeking better organization find that using a license plate number for rows, racks, bins and pallets works best. Using scannable barcodes lets users with mobile devices easily retrieve inventory.

Using this method reduces lost inventory, incorrect counts and locations. It also makes tracking individual products faster and easier such as when repacking items.

Labeling all warehouse locations is also critical when streamlining operations. Two common methods are Serpentine and Standard. Most companies follow a four location naming standard with aisle, rack, row and bin.

Figure: 2Layout of a Typical Warehouse in a Chemical Distribution Company

Layout of a typical warehouse in a chemical distribution company

The third main process used by chemical distribution companies is capacity planning or master planning.

These companies should plan to break bulk and repack, changing labels at each stage. Master plans help track human resources, label printers, packaging machines and other devices.

Typical operations such as repackaging or breaking bulk require those stations and their operators. These functions cannot occur when either is unavailable.

Distribution companies seeing fast moving or express items require planning that is more agile. Agility requires operating on a net change mode instead of completely recreating set-ups every hour. Having that flexibility helps planners make key decisions and set priorities that optimize the work effort.

Figure: 3High-level view of Master Plan in Microsoft Dynamics 365

High level view of master plan in Microsoft dynamics 365

The fourth major process is production and packaging.

Production in chemical distribution companies uses light manufacturing operations such as repacking. A bulk container is opened and quantities required to fill an order are removed.

Typical work orders include operations such as filling, packing, labor, quality and Labeling. The yield provides the quantities and costs to produce each container.

Labeling is the fifth major process.

Labeling is an additional operation on the shop-floor. Including an integrated label management solution included in normal workflows ensures merchandise is properly tracked.

Figure: 4High-level Repack Process in Chemical Distribution

High-level Repack Process in Chemical Distribution

The last two steps are order management followed by billing.

Once inventory is available, warehouse pickers should select the fastest route that lets them gather all items to fill that order. Items are then packaged, labeled and wrapped. Typically, they include certificates of analysis, safety data sheets, a packing slip and a bill of lading. Smaller orders often include a commercial shipping service tracking number.

As soon as everything is packed and shipped, the final step is sending the customer an accurate bill.

Figure: 5High-level Customer Sales Order to Shipment in Chemical Distribution

High level customer sales order to shipment in chemical distribution

Get a demonstration of Microsoft Dynamics 365 for your chemical distribution needs.

Schedule Demo

What a Distribution Company Looks Like in Microsoft Dynamics 365

Below is a quick view of what a chemical distribution company would look like in Microsoft Dynamics 365 assuming all required raw materials are available.

01.Products

This information is maintained within the Product Information Management (PIM) module. For a chemical distribution company, it is the heart of supply chain and manufacturing.

At a high level, Product falls into these categories:

Item Group Type Defination
Item – RM Raw Material Ingredient Purchased
Item – INT Intermediate Produced as Part of the Formulation
SKU Finished Product Containerized Finished Product through a Formula
Label Package – Raw Material Labelled Raw Material
KIT Finished Product Packaged into 1 case with same SKUS
BOX Package – Raw Material Package Purchased
Container (Tote, Drum, Etc.) Package – Raw Material Package Purchased
Package (Cases, Kits, Etc.) Package – Raw Material Package Purchased
Services Services  
Supplies Expensed Packaging Material, Lab Supplies, Office Supplies, Etc.  

In addition, companies should define products requiring tracking by batch, location and license plate. These items may also require coverage settings, lead times and other attributes such as chemical properties and label elements such as hazard statements, pictograms and hazard symbols.

02.On-Hand Inventory

Having a detailed view of inventory by batch, serial number, site, warehouse, location and license plate number for each product provides an inventory snapshot. The data applies to multiple roles such as planners, buyers, customer service representatives and materials managers.

D365 can also produce an inventory value report. It shows inventory quantity and total value plus the physical and financial cost by unit. Having a view into on-hand inventory value for both inventory and WIP can then be reconciled back to General Ledger.

In Dynamics 365, there are many different ways of slicing and dicing inventory. One screen is an on-hand list view displaying all available inventory based on dimensions. Selecting the dimension displays the site, warehouse, location, batch and serial number.

On-Hand Inventory step 1

On-Hand Inventory step 2

03.Sales Orders

D365 is versatile in terms of orders for chemical products, kits or cases. In Microsoft D365, customers can have products shipped to them or directly to their customer.

This process starts when customer service creates a sales order with the customer’s PO number. They add the products being shipped to the customer. The order can include specific customer instructions and notes. Notes and attachments can be set for printing on specific documents such as the packing slip or bill of lading.

For distribution, Microsoft Dynamics provides a Distributed Order Management (DOM) indicator. It provides a complete picture of inventory across the warehouse and ensures the order processes correctly.

Sales Orders Step 1

Sales Orders Step 2

Sales Orders Step 3

04.Master Planning

Depending on how the packaged items are set up for planning (e.g., min/max, requirement or period) with lead times and calendar setup, companies can run a master plan in a regeneration mode. This mode displays all supply, demand, planned supply and forecasted demand or net changes since the last full master resource planning run.

Typically, companies run master planning for all items or items under a certain coverage group such as fast moving items.

Master Planning

05.Production of Kits and Cases

Microsoft Dynamics 365 has extensive functionality supporting all chemical distribution company production operations. The operations can be streamlined for simplicity or conform to current methods.

For example, setting a production order in D365 can include finished goods produced, work planned, tracking operations, routes, resource cost and job scheduling.

Different views are set based on security roles and privileges. These allow different sets of users to view the production order, picklists, route cards or job cards.

Production of Kits and Cases step 1

Production of Kits and Cases step 2

Production of Kits and Cases step 3

Companies can also use Gantt charts to visually see planning and job scheduling. D365 has a powerful visual planning and scheduling tool that comes handy when scheduling tasks for all sales orders planned during a day, week or a month.

Production of Kits and Cases step 4

Bill Of Materials(BOM) journals are used in the production process to add finished goods into inventory and to reduce the inventory components within the formula or BOM.

These journals help reduce the process time instead of using a full production order.

A BOM journal cannot perform functions like tracking jobs and operations. It also is not part of visual planning.

Production of Kits and Cases step 5

Note: Xcelpros earlier blog post on “Operational Challenges in a Chemical Company: Key Solutions” explains production and operations in more detail.

06.Shipments

International shipments add export documentation not required for domestic deliveries. Both shipment types use a common document set generated by D365.

Using D365’s advanced warehouse management functions, outbound work and a shipment wave is created to pick products and put-aways for packaging.

D365 enhanced with the power of Integrated Chemical Management (iCM) prints a documentation package including:

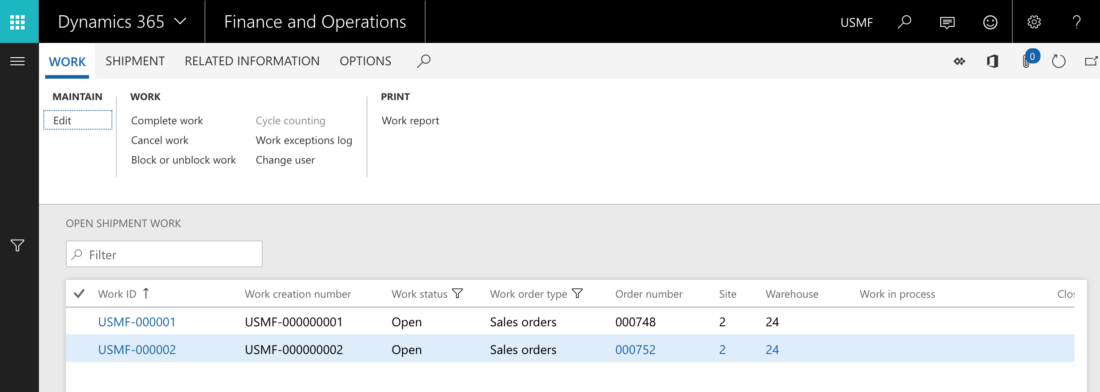
  • Warehouse Work: Displays sales order number, work number, product batch or lot number, license plate information and put-away location in barcode formats. Work is processed using a barcode device.
  • Packing Slip: Displays the sales order number, customer PO number, delivery method, ship date, product to be delivered, quantity delivered, unit of measure, batch number or lot number delivered, ship to address, ship from address, back-order quantity and other related information.
  • Bill of Lading: Displays ship to address, sales order number, hazard information, pallet information, number of boxes, master bill of lading number and related materials.
  • Certificate of Analysis (C of A): Displays product, company logos for private label customers; test specifications; test results including visual, fraction, integer tests; approver information; expiration dates or best before dates; and test dates.
  • Safety Data Sheets (SDS): Displays product label information, pictograms, hazard statements, warning statements, transportation and U.S. Department of Transportation required information by country and language, CAS number information, etc.
  • Shipping Labels: Displays company logo, ship to address and product information.

Shipments step 1

Shipments step 2

07.Invoicing

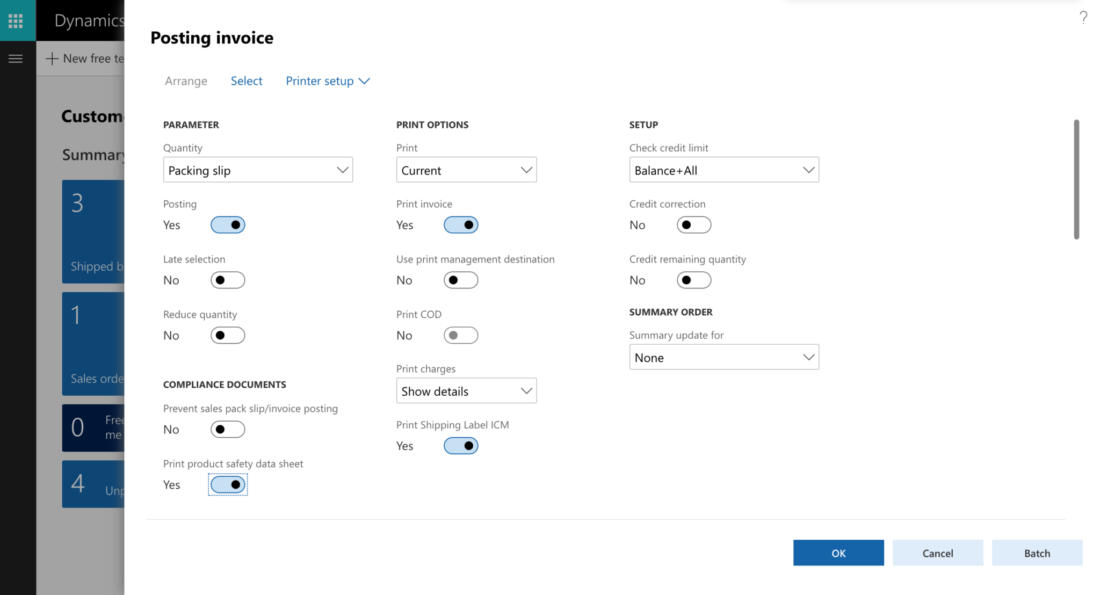
After shipments are done, Microsoft Dynamics 365 gives companies the ability to create invoices in a batch mode or mass select shipments for invoicing. The system also lets them print or email a specific customer email address.

Invoicing step 1

Invoicing step 2

Invoicing step 3

Key Takeaways

Chemical distribution company executives should compare what their firm looks like now and how it might look after migrating to Dynamics 365.

D365 allows companies to streamline processes with a robust, simple, easy to understand and powerful system. Its ability to integrate with other Microsoft applications allows your company to fully integrate and enhance efficiencies.

Power tools such as master planning and production Gantt charts provide the ability to plan and schedule your production operations.

Microsoft Dynamics 365 helps boost your business efficiencies through the “one Microsoft ecosystem” by working seamlessly with products such as Office 365.

Microsoft Dynamics 365 can address most chemical distribution company requirements without modification.

The Differentiator - one Microsoft ecosystem

What does your company look like in Microsoft Dynamics 365? Talk to us to take a test drive.

The Road to Success Implementing Microsoft Dynamics 365

Jump-starting resilient and reimagined operations

Jump-starting resilient and reimagined operations 700 500 Xcelpros Team

Jump-starting resilient and reimagined operations

Based on a wonderful piece from our friends at McKinsey, describing the effort needed by businesses moving forward after COVID disruptions. A reminder that businesses able to maintain a certain level of speed during the transition can create a significant long-term advantage.

Get a consultation to learn more about building resilient operations for your company.

Get Started

How an ERP system can help improve Manufacturing performance

How an ERP system can help improve Manufacturing performance?

How an ERP system can help improve Manufacturing performance? 700 500 Xcelpros Team

At a Glance

  • Installing modern enterprise resource planning (ERP) software comes at a high cost for manufacturing companies. They want to use their software investments to maximize manufacturing performance.
  • Manufacturers can best use their ERP model by letting their production line and vendors work in tandem with the software to streamline processes.
  • ERP systems are no longer a part of the business backend. Newer tools and applications like cloud computing, Internet of Things (IoT) and Machine Learning are changing ERP systems. All of these technologies affect overall return on investment (ROI).

Introduction

The general benefits of using a comprehensive tool like ERP are well known by most manufacturing organizations regardless of size. However, there are still ways with which ERP systems can be used to better overall operational efficiency in manufacturing, streamline existing processes and improve the production line. How solutions like ERP become the catalyst in generating ROI are usually the difference-makers for the manufacturing sector.

Mid-size businesses’ adoption of ERP software will grow at a CAGR of 7.9% from 2014 to 2020.– alliedmarketresearch.com

As more companies modernize their ERP, they want to understand how they can adapt and manipulate their current practices to maximize their technology investments. First, understand how ROI is calculated in terms of ERP in the manufacturing industry.

Figure 1:Determining the ROI of Manufacturing ERP

Determining the ROI of Manufacturing ERP

Calculating the ROI for ERP Manufacturing: A Comprehensive Look at the Benefits of Installing an ERP System

Every organization has specific short and long term goals in mind when installing an ERP system. While the ROI might be a relative concept for every manufacturer, certain common areas can help decide the benefits an ERP system brings to your company:

  • Does the ERP system help streamline production processes and improve overall production line efficiency?
  • Does it reduce human intervention, lowering the cost of labor for data management and analytics?
  • Does it help better manage purchases, procurements and inventory?
  • Does it provide real-time visibility across the production line for improved communications and faster response times?
  • What other tangible benefits in terms of cost savings and profit gains can you see after installing the ERP system?

Answering these questions lets you calculate the ROI for your ERP.

Take Our Assessment to Get Started With Digital Transformation.

Get Started Now

The Road to Better Manufacturing ROI: Improving Manufacturing Performance with ERP

01.Efficient Machine-to-Machine and Machine-to-Human Interaction

In today’s cloud-dominated software world, everything is connected through the Internet. Manufacturers can enhance their ecosystems by making real-time connections between the workforce and machines. When everyone from the top floor to the shop floor can view the entire production line, it lets skilled workers use smart manufacturing techniques to save time and effort.

Using ERP software to adopt smart manufacturing techniques helps manufacturers avoid production delays while efficiently tracking material and equipment. Using these methods will generate significantly more revenue.

Figure 2:ERP in the Manufacturing Industry

ERP in the Manufacturing Industry

02.Better Inventory Management

Large-scale manufacturers can afford to hire a larger workforce to manage their inventories. Small and mid-scale businesses lack that luxury so inventory problems can cause financial losses. Efficient larger companies are looking for a centralized network that can keep track of raw materials, incoming and outgoing shipments plus maintenance schedules.

A sturdy, modernized ERP system is designed to handle these tasks where older legacy platforms fail.

ERPs allow companies to get real-time data on their inventory, allowing them to better predict and manage inventory. Every manufacturing company—large or small—understands that accurately managing inventory is a must if it wants to avoid stock-outs and related production delays. A robust ERP system improves ROI by helping manufacturers more accurately manage inventories.

03.Forming a Competent Skill Base

Advanced software and or mechanical tools can only help boost ROI when the workforce is trained in how to use them. An ERP system is no exception. When an ERP is integrated with cutting-edge applications like IoT, machine learning, advanced analytics, and artificial intelligence, training becomes critical. Having a well-trained, expert workforce lets companies take full advantage of their ERP. Taking the time and spending the money to train staff reduces problems and provides long-term profit gains.

Key Takeaways

Making these changes in your manufacturing ecosystem will help you maximize the benefits of your ERP system. They will also solidify your work standards and technical competencies.

  • The cost of installing a modern ERP system for manufacturers is countered by improving the return on investment.
  • Regardless of size, manufacturers should look at ERP software as an integral part of their production line. Training their workforce in how to use its many features will boost overall profits.

mistakes that slow the growth of a chemical manufacturing company

Mistakes that slow the growth of a chemical company

Mistakes that slow the growth of a chemical company 700 500 Xcelpros Team

7 Quotes

Companies need to grow if they wish to flourish and prosper. There are many quotes already related to business growth you might have heard before, including:

  • “Conformity is the jailer of freedom and the enemy of growth,” President John F. Kennedy
  • When you stop growing, you start dying,” author William S. Burroughs
  • “Every problem is a gift —without problems we would not grow,” motivational speaker and author Anthony Robbins
  • “Out of your vulnerabilities will come your strength,” neurologist Sigmund Freud
  • “Strength and growth come only through continuous effort and struggle,” author Napoleon Hill
  • “The only way you are going to have success is to have lots of failures first,” Google co-founder Sergey Brin
  • “The journey of a thousand miles begins with a single step,” Chinese philosopher Lao Tzu

Introduction

What do you consider growth for your business? How this is measured is up to each individual organization. Data points that highlight company growth includes:

  • Sales
  • Revenue
  • Profits
  • Company Value
  • Number of customers
  • Number of Employees

The next question to ask is, “Are you growing in a way that is sustainable and lets you achieve all of your company’s goals?” As they grow, companies can make several mistakes that doom their opportunities for growth.

According to Growthink, the most common growth-related mistakes are:

  1. 1.Ignoring the Ansoff Matrix—also known as the Product/Market Expansion Grid—that details ways to increase sales.

Figure: 1Ansoff Matrix: Product-Market Expansion Grid

Ansoff Matrix: Product-Market Expansion Grid

  1. 2.Failing to conduct market research, such as a SWAT (strengths, weaknesses, opportunities and threats) assessment.
  2. 3.Developing weak financial models showing the impact of each growth opportunity.
  3. 4.Forgetting what worked in the past for your company.
  4. 5.Starting at the wrong place and lacking a clear vision of where you want to go.
  5. 6.Lacking focus, which can occur when a company lacks a clear growth plan.
  6. 7.Ignoring the human factor by not having the right people.

Chemical Industry Mistakes

The previous items apply to all companies wanting to grow, regardless of industry. The heavily regulated pharmaceutical and chemical industries face additional challenges when they want to grow.

According to Global Safety Management, these unique challenges include:

  1. 8.Ignoring jurisdictional regulations.
  2. 9.Costly errors from operations.
  3. 10.Failing to evolve into an intelligent enterprise.
  4. 11.Delivering products, not business outcomes.

Ignored regulations often result in hefty fines. For example, if your pharmaceutical company sells its products in Europe, and then decides to expand into the U.S., not following FDA labeling regulations is a major no-no. Violating Section 21 of the Federal Food Drug and Cosmetic Act (aka, title 21, section 331) mislabeling a prescription drug for interstate commerce is expensive. Penalties include prison sentences up to 10 years, fines of up to $250,000 and civil penalties up to $10 million, the law firm of Wallin & Klarich states.

Problems often result from manufacturing errors and omissions. Many of these can be traced to the supply chain. For example, inaccurate inventory counts lead to starting a production run only to discover a key ingredient is missing, stopping production.

Evolving by using available technology as a way of moving forward can be done when company leaders are looking toward the future. Tools exist today—such as the Industrial Internet of Things (IIoT) coupled with modern enterprise resource planning (ERP) software—to let small and medium-sized businesses grow. They also let larger companies get even bigger.

Having total control over your inventory and an ever-changing grasp of your supply chain lets you reduce raw materials and shipping costs while still delivering products on time.

Translation Errors Can Prove Fatal

The final error in our “devils’ dozen” is:

  1. 12.Translation Mistakes.

Let’s face it: many American chemical manufacturers purchase materials from suppliers outside the U.S. and ship finished products overseas. That means labels must not only be in the languages used by your customers and others in the supply chain, they must also meet safety regulations at their destination.

If, for example, a formula using imperial measurements (i.e., pounds and ounces) is incorrectly translated into its metric equivalent or instructions are unclear, the resulting product may fail safety and purity tests. Poorly translated labels could cause regulators to deny a shipment until the products are relabeled correctly. Translation errors could even result in a large batch failing its tests, wasting the materials, time and equipment.

“If the mistakes are severe enough, the resulting chemical combinations could be dangerous or deadly for staff members who follow mistranslated instructions to the letter,” GLTaC states.

Under terms of the European Chemicals Agency’s Registration, Evaluation, Authorization and Restriction of Chemicals (REACH) act of 2006, dossiers are required on each substance produced or imported weighing more than one metric ton.

“Inaccurate information due to translation mistakes could result in regulatory action by the European Chemicals Agency that could prove financially crippling,” GLTaC, a translation services provider, warns.

Technology Helps Reduce Mistakes

ERP software like Microsoft Dynamics 365, especially when paired with something like Xcelpros’ Integrated Chemical Management (iCM), helps companies better manage their growth.

Figure: 2Integrated Chemical Management with Microsoft Dynamics 365 Supply Chain Management

Integrated Chemical Management with Microsoft Dynamics 365 Supply Chain Management

ERPs can work with IIoT sensors, gathering large quantities of data. Dynamics 365 Finance helps turn the raw numbers into actionable data. Using this data, and the charts and graphs created from it, executives can spot areas operating inefficiently. For example, machines are down and staff is doing make-work while waiting for earlier cycles to complete.

Having access to real-time numbers lets these leaders know where changes can occur, boosting overall production.

iCM helps chemical companies hit their growth targets. It integrates seamlessly into D365’s Finance module, providing impeccable security. Among iCM’s value propositions are:

  • Built-in labeling and safety data sheets (SDS)
  • Fully integrated SDS management
  • Real-time SDS data sheets are consistent and compliant with Global Harmonization System requirements

These SDS features reduce the total cost of ownership (TCO) by removing the need to maintain product safety documentation and data in-house.

iCM becomes the repository of record for all regulatory data while making it accessible to authorized D365 users. It also integrates SDS authoring at the formula/item level, embedding workflows for authoring and approvals.

Xcelpros’ product adds to one of D365’s many strengths: its labeling prowess. The Supply Chain Management module lets companies track products from the moment raw materials arrive in their warehouse to the instant a customer receives them. iCM builds on the existing technology, further focusing on the chemical industry.

For example, iCM becomes the system of record for all labels, integrating them into operational workflows like production and shipping. To learn more, download the iCM brochure.

Figure: 3Translation Service Process in Dynamics 365

Translation Service Process in Dynamics 365

Customers using D365 also have access to the Dynamics 365 Translation Service (DTS). Hosted in Microsoft Dynamics Lifecycle Services (LCS), it uses a machine translation system to maximize translation output quality. It also recycles linguistic assets from D365 and partners, such as Xcelpros. DTS is compatible with D365 Finance, Commerce and CRM modules among others.

Summary

Chemical companies face potential mistakes common to all growing businesses. In addition, they also face certain hurdles that other industries do not. Regulation is a major issue for chemical companies, especially those who rely on raw materials and finished products made outside the U.S. or shipped overseas.

Taking advantage of technology like Microsoft Dynamics 365 and Xcelpros’ unique Integrated Chemical Management software can help prevent these mistakes and let executives continuously grow their companies.

Get a consultation to learn how to resolve critical problems in your chemical company.

Get Started

References: Distribution Of Mislabeled Products In Interstate Commerce

Fraud and pharma inventory control tech reduces rip offs banner

Fraud and Pharma: Inventory Control Tech Reduces Rip-offs

Fraud and Pharma: Inventory Control Tech Reduces Rip-offs 700 500 Xcelpros Team

At a Glance

Making and selling fake versions of drugs for treating erectile dysfunction, high cholesterol, hypertension, cancer and other illnesses is big business.

  • $75 billion – $200 billion: The current annual revenue lost to counterfeiters
  • 13: The number of new drugs not produced in one year because of fake drugs

By the Numbers: Counterfeit Medicines

Reports by Outsourcing-pharma.com and Statista show just how much money counterfeit costs legitimate pharmaceutical manufacturers. Statista estimates the global market for fake drugs alone at $200 billion, accounting for 13 new drugs not being brought to market each year.

Other numbers of note include:

  • $100 billion – $431 billion: The estimated sales value lost to counterfeit drugs worldwide in 2020
  • 6–28: The number of new drugs not brought onto the market because of the effects of counterfeits through the impact on intellectual property rights
  • $103 billion (€92): The amount of money lost to European producers from 2012-2016 for counterfeit products including medicines
  • $19.45 billion (€16.5 billion): The amount lost to European pharmaceutical manufacturers, which was second only to clothing, footwear and accessories
  • 80,459: The number of pharmaceutical jobs affected by counterfeiters

Sources: Outsourcing-pharma.com, Statista.com

The National Crime Prevention Council has its own statistics on the cost of fake drugs:

  • 10%: The amount of all drugs in the global supply chain that are fake
  • 70%: The percentage of fake drugs in some countries
  • $75 billion: An estimate of global counterfeit drug sales from the Center for Medicine in the Public Interest quoted by the NCPC
  • 15,000: The number of illicit drug factories in India accounting for 75 percent of the world’s counterfeit drugs with other producers primarily in under-developed countries

Spotting a Fake

The Food and Drug Administration protects consumers from counterfeit medicines. “Drug safety and quality no longer begin or end at our border. The U.S. government works with foreign regulatory counterparts when possible to disrupt or close illegal operations involving the production and distribution of counterfeits,” the FDA states.

Figure: 1Identifying counterfeit medicine

Spotting a Fake pharma product

Identifying counterfeit medicine:

  • Packaging different that expected
  • New or unusual side effects
  • Medicine is available for purchase online

Resellers can protect themselves and their customers by only buying from authorized and licensed companies.

Resellers should also read the packaging. Potential fake products from unlicensed sources can be misbranded, adulterated, contaminated, improperly stored and transported, ineffective or unsafe, the FDA states. Some counterfeits have been spotted without a National Drug Code (NDC) number. Others have misspelled labels.

Among the medicines reportedly being copied and sold in the U.S. during the last five years are:

  • Symtuza ® from Janssen Pharmaceuticals (Dec. 24, 2020), used in the treatment of HIV
  • BiCNU ®, a cancer-fighting drug from Emcure Pharmaceuticals, Ltd.
  • Botox ® from Allergan
  • Cialis ® from Eli Lilly

Dangers of Using Counterfeit Drugs

Counterfeit drugs affect more than just legitimate companies: they harm people using them. Citing a 2017 World Health Organization (WHO) study, the OECD iLibrary states the effects on individuals of counterfeit medicines include:

  • Adverse—and possibly toxic—effects from incorrect active pharmaceutical ingredients
  • Ineffectiveness by not treating the targeted disease
  • Loss of confidence in health care professionals and health systems
  • Lost income by users from extended illness or death

The OECD report also referenced a 2019 Novartis in Society Report. Forensic tests of counterfeit medicine samples showing patients could be harmed by 90 percent of the counterfeits.

Fighting Counterfeit Drugs

Pfizer, one of the world’s largest drug manufacturers, supports the international “Fight the Fakes” campaign raising awareness of the dangers from using counterfeit medicines. Pfizer states that counterfeit versions of 105 Pfizer products were found in 113 countries. The company works with law enforcement agencies, wholesalers, pharmacies and others to increase inspection coverage, monitor distribution channels and use other methods to fight back.

One way pharmaceutical companies are fighting back is through the Drug Supply Chain Security Act (DSCSA). Enacted in 2013, the act requires manufacturers, contract manufacturers, repackagers, wholesale distributors and other meet compliance requirements.

A large part of this involves labeling.

For example, a warehouse receiving clerk can print labels after receiving raw materials but before putting them away.

Using Wave label printing, labels are available before workers run the work order on a mobile device. Workers then attach the labels during picking instead of after picking. Label printing options include:

  • According to the number of cartons on a single work line
  • With different sequences such as carton and pallet labels
  • Creating a unique serial shipping container code (SSCC) for each carton and including it on the label
  • Creating globally usable GS1-compliant numbers for bills of lading and SSCCs

Using Labels to Combat Counterfeiting

Among the labeling and packaging methods used to fight counterfeiting are holograms, 2-D barcodes, radio frequency identification tags (RFID) and packaging features that are either visible (overt) or hidden (covert).

NeuroTags, which makes these types of tags, states that it is easy for counterfeiters to make simple holograms and copy legitimate images. Luminescent topcoats revealing patterns and colors under special lighting are difficult to imitate, making it a good anti-counterfeiting solution for pharmaceutical products.

Smart Labels—also known as Smart Tags—have an RFID tag with a computer chip, antenna and bonding wires under a conventionally-printed barcode label. Among their benefits for the pharmaceutical industry —beyond being difficult to copy—is their ability to track temperatures. This is critical for some medications, such as the current Covid-19 vaccines from companies such as Pfizer and Moderna.

Another benefit of smart label technology is letting companies track items in real time. “It fulfills the requirement of tracking objects remotely, effectively, and most importantly at an affordable price,” Packaging Strategies.com states.

Combined with Microsoft Dynamics 365 Supply Chain Management, these types of labels make it difficult for counterfeiters to substitute cheap, ineffective and dangerous knock-offs for real medications.

D365 Supply Chain Management functions let companies track products from the moment raw materials arrive in the warehouse, through the production process and on to the sales floor.

Customers with equipment required to read the labels—and personnel trained in what to look for—will be able to distinguish legitimate goods from the fakes.

Summary

Counterfeiting pharmaceuticals costs the industry billions every year. It affects not only sales profits but intellectual property rights. Combining different types of labels such as Smart Tags with inventory tracking software lets pharmaceutical manufacturers know when real goods arrive at their destinations. It also lets them know when someone along the supply chain stole their products and replaced them with fakes.

Get a consultation to learn about pharmaceutical industry fraud.

Schedule Call

Standard costing in pharmaceutical manufacturing banner

Standard Costing in Pharmaceutical Manufacturing : Industry Challenges & Solutions

Standard Costing in Pharmaceutical Manufacturing : Industry Challenges & Solutions 700 500 Xcelpros Team

At a Glance

Costing methods for pharmaceutical manufacturing, especially the standard cost method, can significantly help reduce hidden costs.

  • On average, 30% of costs go undetected due to poor business practices and the inability to detect them.
  • Improper habits of recording data can be a major culprit in accumulated hidden costs.
  • The Standard Cost Method provides a simpler solution, offering insights into daily cost, cost variance and profitability analysis for pharmaceutical manufacturing companies.

Introduction

Forecasters are projecting more opportunities for mid-market pharmaceutical companies operating in the US. These opportunities will require more streamlined processes within pharmaceutical manufacturing and contract development and manufacturing organizations (CMOs and CDMOs). The most recent projections included the following:

  • The global medicine market is expected to top $1.4 trillion by the end of 2021, Grand View Research states. Anticipated spending on medicine in the U.S. alone is expected to grow to $655 billion at a rate of 4% – 7% by 2023. followed by pharmerging countries —emerging nations in areas such as Africa and parts of Asia—hitting $385 billion (5% – 8% compound annual growth rate) and the top five European countries at $225 billion (1% – 4%). Japan will either lose 3% or stay even, a report from the IQVIA Institute for Human Data Science notes.
  • Rising research and development (R&D) costs are being accompanied by more stringent testing requirements.
  • American companies introduced 138 new chemical or biological entities (NCEs and NBEs) between 2016-2020, according to Statisa.com. Europe produced 64, Japan released 38 and the rest of the world generated 48 for a total of 288 during that span. This compares to 226 from 2011-2015 and 146 a decade earlier, IFPMA states.

Figure: 1Global Pharmaceutical Market sales in 2019

Global Pharmaceutical Market sales in 2019

Change Accounting Methods

Adapting to these changing market dynamics requires changes in accounting across the pharmaceutical industry. Companies will need to become more sophisticated when it comes to their methods of costing, profitability analysis and production variance calculation and reporting.

A few ways to achieve these goals include standard costing methods, following best practices and optimization within a pharmaceutical batch manufacturing company. Also fairly critical in today’s highly-regulated environment will be much more accurate reporting of data.

The Never-Ending Challenges of C-Level Reporting

Determining the overall profitability for a product is a major concern for any C-Level executive. Calculating cost structure in the pharmaceutical industry is especially tough to determine when it involves fast-moving raw materials, labor, overheads and other indirect costs.

For pharmaceutical companies, one prime objective is following standard operating procedures (SOPs) in adherence with the FDA’s compliance reporting rules. In the past, companies have placed so much focus on staying compliant it becomes easy to lose sight of key indicators that drive profitability and organizational goals.

In continuous production and batch manufacturing processes, the multitude of activities involved requires costing for each activity. This can be tough as many moving parts make it hard to identify the right cost breakdown structure. Despite the difficulties, companies must measure true costs for stakeholder reporting.

True costs vary from those assigned by traditional cost-accounting methods by 30 to 100 percent.Source: -Per McKinsey

What matters to the CFO?

CFOs don’t look at a single product or product line. Instead, they often prefer a much broader view when determining what matters the most, like the details needed to determine actual costs and how any variances came to be.

Since the manufacturing process is so heavily intertwined with product costing, the need to highlight different elements that aid in standard cost determination and variance reporting becomes even greater. Some reporting structures use backflush costing methods to delay costing until an item is manufactured. This can be a reporting nightmare when it comes to analytics and production performance metrics.

It’s common for some people to analyze these costs and variances using things like Microsoft Excel spreadsheets with complex macros and v-lookups. Analyzing true costs this way is extremely challenging, especially when your system doesn’t keep track of perpetual costs until the completion of a production job.

Data Capture Discipline and Lost Visibility

Longer production campaigns in continuous processing can have individual processes taking days, weeks or sometimes months. Recording actual numbers based on material and resource consumption to report standards compared to actuals becomes tedious. Enforcing process discipline is one way to help streamline this part of the job.

Gaining clarity and determining actual costs can take hours of data crunching, the process becomes harder and more complex when you take into account any reworked batches or lots. All the different moving parts of reworked jobs can make it tough to determine the additional cost of starting materials, line clearance, labor and machine hours that get compounded to the original batch cost.

Human capital, machine or work center hours need to be planned across multiple production jobs. Proper planning helps accurately source and schedule labor while allocating machines to each production run.

5%

High-performance pharmaceutical companies have about 3% of rework products when compared to the average companies that have about 8%

Source: -Per McKinsey

People and Processes Impact Costs and Profitability

A large amount of time and resources are spent trying to recover inefficiencies caused by following improper procedures in day-to-day operations. These inefficiencies may be due to the lack of any properly identified key performance indicators (KPIs), processes or methods to track efficiencies.

Understanding the total cost of each batch helps proactively plan for producing other similar “A” grade items. The Production Planner cares less about cost and more about capacity roadblocks. They want to know how additional material and resource requirements could lead to unplanned downtimes.

Warehouse operators need to record consumption. Their figures are based on when Quality Control (QC) tells them to proceed with the job, how much to consume on the batch and how many hours were already recorded. CEOs want to know if the operators have systems and processes in place to capture critical data in real-time.

Many equipment operators tend not to record data during operations, waiting instead till the end of the production run to capture any data.

Production managers constantly look for ways to substitute materials to meet timelines, quality standards and batch potency, all while following existing company rules. At the same time, they need to accurately record batch data. Using Internet of Things (IoT) sensors that capture this data as it occurs in real-time and feed it directly into the ERP system provides this accurate, continuous data flow.

Batch Manufacturing – An Example

Some long-running batch manufacturing processes require hourly quality control tests. Depending on the PH values and other data, operators add chemicals and make other changes to achieve the desired results. From a cost accounting perspective, the quantity of materials consumed from inventory may not be recorded. This causes inventory records to become out of sync and inaccurate. Not knowing what and how much is used may cause a controller to categorize these additions as overhead costs.

Some practical solutions to ensure materials added during ongoing production testing are accurately recorded include:

  • Having an industrial grade tablet or mobile device on the shopfloor to aid in data capture. Products and quantities are captured when operators have the time to input them.
  • A more accurate method uses IoT sensors that tracks starts, stops and inputs within each tank. IoT sensors can also generate an alarm when deviations occur.
  • Barcode readers and scanners are also helpful in capturing product use data on the shopfloor, and can be easy to operate.
  • Training staff on simple new production processes helps ensure every team is performing the right task at the right time.

Tracking electronic signatures helps ensure the right people are performing each process and can help prevent incorrect practices.

High-Level Production Process

High-Level Production Process

Standard Cost Calculation

How are standard costs determined in a sophisticated mixed-mode manufacturing ERP system, where process manufacturing and discrete processes occur within the same operation facility? These costs are derived from standards set on the formula or build of materials (BOM) depending on a combination of the:

  • Batch being manufactured
  • Contents of each container
  • Hours spent on each operation
  • Standard resource costs per unit price

The calculated cost of materials using a formula or a BOM is derived from individual raw materials or intermediate costs. The cost of operations comes from resources and machines assigned to the task.

Past history helps set accurate standards to proactively manage production runs and accurately record production costs.

C-level executives tracking profitability and plant managers whose bonuses depend on higher margins are constantly looking to reduce redundant spending caused by operational and resource inefficiencies.

Figure: 2Standard Costing Formula

Standard Cost Calculation

Standard Cost Calculation Results

What Should Happen When Estimating Production Costs

The first step in estimating production costs is planning the size of each batch. Your ERP system should automatically scale from the standard batch size and identify the standard cost. Using the ERP data provides an insight on other decisions about the batch such as identifying the right margin and setting an appropriate selling price. These figures can appear on customer quotes and sales orders.

As production jobs are released to the production floor, operators allocate all appropriate raw materials for consumption. When this happens, a good inventory tracking system such as that in Microsoft Dynamics 365, marks those specific raw material lots as unavailable for other batches.

Allocating raw material lots and resources correctly and timely recording data in a modern Pharmaceutical ERP has benefits. They include controlling unnecessary mistakes and coverups, providing a true picture of product costs.

Standard Cost Rollup

The standard cost rollup for a manufactured product is made up of direct material, direct labor, overhead and indirect costs.

Following actual raw material consumption, there is a tendency to not record point-in-time information for fear of making mistakes or making errors while not tracking what was altered from standards and causing a variance.

The Consumption Process

During raw material consumption, physical inventory is relieved by directly booking material costs to Work-In-Process (WIP). If we were to assume that the only changes on a production run is to the overall labor and machine time on operations, then all standards relieved from WIP would book production and quantity variances based on standard.

raw material consumption Process

Using a Multi-Tier Formula or BOM

A more complicated scenario occurs when there is a multi-tier formula. The production produces intermediate products that are then used in the next tier. Additional raw materials are added. This process continues until the product is finished, in some situations, yields are tallied before moving to the next step.

In others, the shop floor goes by standards, recording adjustments to materials and operations after the final finished lot is produced. In this scenario, all tiers in the multi-tiered process are only closed at the end. This process can cause a complicated cost calculation considering all the elements involved plus any variances.

Multi-Tier Formula or BOM for Production Process

Key Takeaways

With proper record keeping and accounting methods, it’s possible to streamline operations and reduce or eliminate unpredictable variances. If you’re not sure where to start, these three steps will help.

  1. 1.Examine your current manufacturing practices and calculate their downstream impact on costing.
  2. 2.Understand how competitors outperforming the market are becoming more efficient.
  3. 3.Identify different methods to improve both productivity and worker efficiency.

Organizations can take advantage of ERPs like Microsoft Dynamics 365 to help pinpoint areas for improvement and focus on company goals. It includes production cost buckets including quantity, substitution and lot variances.

Contact Xcelpros to learn more. Xcelpros loves to show customers how they stand to benefit from the sophisticated analytics and business intelligence tools embedded within D365’s Finance and Supply Chain Management systems. These tools provide the necessary insights to grow and stay ahead of the market.

Get a Consultation to learn how to improve standard costing in pharmaceutical manufacturing.

Get Started

References: Pharmaceutical manufacturing market 

latest trends in pharmaceutical manufacturing industry banner

Latest Trends in Pharmaceutical Manufacturing Industry 2021

Latest Trends in Pharmaceutical Manufacturing Industry 2021 700 500 Xcelpros Team

By the Numbers

In a July 2021 report, Grand View Research estimated the 2020 global pharmaceutical manufacturing market value at $405.52 billion. Key metrics include:

  • 11.34%: The industry’s expected compound annual growth rate (CAGR) from 2021 – 2028
  • $957.59 billion: The revenue forecast for 2028
  • 77.95%: The retail segment market share in 2020

The IQVIA Institute for Human Data Science used a five-year estimate from 2018-2023 in its 2019 report. This report estimated spending on medicine to top $1.4 trillion by the end of 2021. Looking ahead to anticipated global medicine spending and growth in 2023 shows the top individual regions in terms of spending and 5-year CAGR as being:

  • United States: $625 – $655 billion, + 4% – 7%
  • Pharmerging: $355 – $385 billion, + 5% – 8%
  • Top 5 Europe: $195 – $225 billion, + 1% – 4%
  • Japan: $89 – $93 billion, – 3% – 0%

“Pharmerging” is a term given to emerging nations in areas such as Africa and parts of Asia.

Figure: 1Estimated medicine spending by companies in 2023

Estimated medicine spending by companies in 2023

Figure: 2Estimated growth rate of medicines by 2023

Estimated growth rate of medicines by 2023

5 Topics to Ponder

Despite all the problems and deaths caused by Covid-19, along with its impact on pharmaceutical manufacturing and the U.S. trade war with China, the market for medicines and related products is staying strong.

Looking several years out, one question CEOs and CFOs must ponder is what changes can we make now to prepare for a profitable future?

According to The Medical Futurist, the Top 5 trends for leaders to consider in the coming years include:

  1. 1.Using artificial intelligence to speed research & development. Spending on AI in healthcare alone is expected to hit $31.3 billion by 2025.
  2. 2.Empowering patients to aid in drug design and advisory boards. TMF notes the Food and Drug Administration has its own patient engagement advisory committee. The FDA states the committee considers different topics including the design of clinical investigations, communicating device benefits and risks, digital health technology and more.
  3. 3.Conducting experiments using computer simulations or “in silico,”. This is another digital trend in pharmaceutical manufacturing. This method eliminates animal testing and side effects on humans and animals. So far, this technology is less than halfway to becoming a reality, though.
  4. 4.Boosting the supply chain with technology such as blockchain to enhance security and improve inventory tracking. “Counterfeit drugs might make a cheaper alternative but are the cause of tens of thousands of deaths worldwide while the fake drug trade continues to be a profitable multi-billion dollar business,” according to TMF.
  5. 5.Using technology to appeal to more providers and payers. TMF mentions a wearable monitoring device and an app for feedback from doctors plus the app itself. Another technology is 3D printed pills such as Spritam that gained FDA approval in 2015.

Another topic mentioned in a different report is using real-world-evidence (RWE). A 2018 report by Deloitte defines RWE as, “clinical evidence about a product’s usage, potential benefits and risks derived from real-world data.”

However, Deloitte’s survey also highlighted three potential barriers to RWE adoption by pharmaceutical companies:

  • 75 percent: Major lack of receptivity by external stakeholders
  • 70 percent: Lack of understanding by internal stakeholders
  • 65 percent: Lack of access to necessary external data

AI and ERPs

Enterprise Resource Planning (ERP) software such as Microsoft Dynamics 365 Finance can support different AI modules, as needed. Depending on a business’ requirements, AI can help conduct research more efficiently, automate manual processes and perform other repetitive tasks.

AI benefits researchers through natural language processing and reasoning, learning from data and optimization addressing problems. One example cited by the Royal Society is using “deep” neural networks to identify features required to solve problems. Another uses reinforcement learning to examine many scenarios and assigning credit to different moves—such as chemical combinations—based on performance.

When it comes to research and manufacturing of pharmaceutical products, AI helps researchers use genomic data to predict protein structures, improving diagnosis and developing new treatments. Using machine learning—one part of AI—to predict the three-dimensional structure of proteins from DNA sequences is another example. This is quickly becoming one of the biggest trends in the pharmaceutical industry in 2021.

By creating a highly-detailed computer model that replicates a human organ, pharma companies can see the effectiveness of different drug therapies on specific diseases.

When it comes to pharmaceutical manufacturing technology, which versions work? What are the side effects? What changes can we make to reduce the side effect’s severity? These are some of the questions AI can help answer quickly and efficiently without experimenting on humans or animals.

In terms of business, “artificial intelligence technology allows businesses to automate a variety of processes, frees up employees’ time and helps improve productivity.” The result is greater output in less time at lower cost, according to Intellspot.

AI also helps capture competitive research and analysis. One tool with that capability is Microsoft Power Bi. This software has three types of AI transformations:

  • Text analytics tags images and extracts key phrases
  • Vision analyzes images
  • Azure ML helps generate insights and predictions

ERPs and Regulatory Compliance

A major obstacle unique to technology in pharmaceutical manufacturing is dealing with FDA regulations. Many of these rules require strict recordkeeping. Modern ERPs, which share data between departments, allow companies to keep more accurate documentation and inventory. ERPs allow executives to review data for accuracy, ensuring that information from Inventory Control matches what Finance says it should report.

A key feature of sharing information between different departments such as Inventory Control and Finance, companies can spot areas for improvement. Are FDA documentation requirements being met? A simple query can give a CEO the answer for any department anywhere in the world.

ERPs can also ensure that product communications meet the FDA’s stringent requirements for truth under the Federal Food, Drug and Cosmetic Act (FD&C Act). These laws can result in severe fines for conveying important information the FDA considers misleading.

Labelling is another major part of FDA rules, one where D365’s Inventory Control Module for Dynamics Supply Chain Management stands out. This lets businesses generate barcodes and other labels, tracking products and batches from the moment they arrive through production to their delivery to customers.

Summary

Pharmaceutical manufacturing technology, like the use of AI or ML in research & development, are quickly becoming leading pharmaceutical industry trends since 2020, helping make pharmaceutical companies leaner and more efficient. Modern software like tier 1 ERPs lets them gather, sort and analyze information obtained from the continuous manufacturing of pharmaceuticals much more rapidly than ever before.

Keep up with the Pharmaceutical Manufacturing trends. Get an obligation trial of Microsoft ERP tailored for the Pharma Industry.

Schedule Demo

Formula Management Scales Up Process Manufacturing

Formula Management Scales Up Process Manufacturing

Formula Management Scales Up Process Manufacturing 700 500 Xcelpros Team

Introduction

Formulas are at the core of process manufacturing and managing them is a critical function in the product development cycle. However, we see manufacturers show little effort in how they store and access their formulas, often keeping them siloed. However, today’s connected world makes sharing information across business units critical.

Seldom are formulas managed with any regularity. We find them in manual logs or at best, Microsoft Excel files. Companies spend years perfecting a single formula, ensuring it is scalable and able to maintain consistent quality across all batches and then restrict access to it.

At Xcelpros, we help our clients modernize their formula management. Keeping these formulas updated and secure from prying competitors results in higher productivity. That translates into a stronger bottom line.

Enterprise Resource Planning (ERP) software such as Microsoft System Dynamics has the ability to manage formulas. An ERP brings consistency, product scalability and improved efficiency to formulas while achieving better compliance scores.

Formula management (FM) includes the ability to optimize formulas. It also creates and manages workflows, creates formula variants, manages labeling content, plans inventory for scaling up production and validates the formulas to meet regulatory requirements.

An essential part of electronic batch processing, FM helps modernize the product development process. The resulting efficiency increase results in shorter times to market.

Automating formulas ensures consistent products. It removes manual calculations of ingredients, their properties and costs, thereby removing a source of error.

This process also causes better regulatory compliance. It reduces the chances of recalls, rejections and fines. Each of these actions costs your firm money while negatively impacting brand value.

The Downstream Impact of Formula Management

As discussed above, formula management is at the core of process manufacturing. Using the chemical industry as an example, formulas are at the center of each company’s assets. The research and development (R&D) section likely has an “n number” of formulas and variations. When each formula is processed, it delivers a unique product. Having related formulas scattered across multiple locations increases the compliance hazard, reducing efficiency.

An integrated FM system gives top executives control of:

  • Transparency in terms of cost – An integrated business application such as an ERP includes ways to control formulas. The software also shows costs associated with the manufacturing process. ERPs give you a holistic picture. They provide the downstream impact of a formula from raw materials procurement to setting end product pricing.
  • Visibility of formula properties – ERPs let you analyze the change in physical properties of key ingredients in real-time. For example, you can vary the quantity or substitute one raw material for another. Making these changes in the ERP lets you see the impact on areas such as the nutritional value of products.
  • Authentication and formula protection – This security feature helps an organization define access rights to each formula. It allows you to limit modification rights to a select few while giving master control to the administrator. The administrator can reverse any changes to the formula.

Your business deserves the power of a unified system for formula management.

ERPs are the Way Ahead

ERPs provide an effective solution with the ability to unify production processes with research and development formulation in a common, secure platform. ERP systems can transform the way formulas are managed by players in industries such as chemical, pharmaceutical, food & beverages, etc.

Keeping formulas confidential is critical for every manufacturer in every industry. Managing formulas efficiently can be a competitive advantage, especially when a company is growing.

Instead of making FM a daunting task, using an ERP ensures your manufacturing processes are standardized across your production units regardless of their location.

ERPs are Transformational

Modern businesses generate gigabytes of data every single day. That number continues to increase as handheld devices and connected systems add to it. ERP software is designed to handle massive volumes of data. It generates insights letting top executives gain deeper understanding of core business functions. Using an ERP, top leaders can see the data behind critical decisions.

Looking at batch processing, which includes FM, leaders have a centralized information source covering all products that being processed, manufactured or stored. Having access to this data in one spot lets leaders generate important business insights.

Batch size, quality, quantity and components are essential items captured by ERPs. The system allows organizations to set security controls ensuring only authorized personnel can access the firm’s trade secrets and formulas. The ERP also maintains a version history of all changes made to the formula, letting authorized people go back to a previous version in case of unauthorized access.

Connecting Silos

In many businesses, data is captured and stored in stand-alone “silos.” A problem with this approach is its inability to share data. This is especially true when data from multiple business functions is captured in different systems.

Siloed data is not easily accessible from systems outside that area. It doesn’t give key executives enough variables to make informed decisions. The silo approach causes inefficiencies and lower returns on investments from technology assets.

Today is the age of connected business ecosystems, not stand-alone silos. Collaboration is the key to efficiency, transparency and easier operations. Sharing data means quicker and informed decision making, all of which eventually leads to success. Only an ERP can break the silo walls, connecting your data to provide a complete 360-degree view of your production process.

A connected system helps you calculate formulas and break down the costs of each product, percolating down to provide improved competitive and operational advantages.

ERP Software Systems and Formula Management

Some areas where ERPs are instrumental in formula management include:

  • Versioning formulas
  • Scaling formulas to create larger batches
  • Determining and establishing coproducts or byproducts
  • Categorizing active ingredient formulas by
    • Weight
    • Percentage
    • Operations related to ingredient consumption
    • Approvers
    • Batch sizes

Figure: 1ERP Software For Process Manufacturing

ERP Software For Process Manufacturing

Versioning Formulas for Compliance

Process manufacturers are continually updating and improving their formulas. Updates are driven by changing industry trends, customer demand and most importantly, ever-changing regulations.

Keeping up with rule changes is a constant task, especially for companies with multinational manufacturing and distribution operations. They must be compliant with the laws in each country where they operate.

Compliance impacts formulas directly, making keeping different versions a “must have” feature. For example, formaldehyde is a chemical agent dangerous to humans at levels of 100 parts per million. It is banned for use in cosmetics across the European Union but is found in hair-straightening products and nail polish in the US. Atrazine is used as an herbicide in the US, but was banned in the EU since 2003 over concerns of it polluting water bodies.

Differing regulations requiring different formulas—even with minor alterations—can be intimidating. Formulas must be managed properly to meet the regulations in each country or region.

Scaling Formulas for Consistency

Another formula function ERPs automate is scaling. When a customer changes its order size, the quantity of raw materials varies. Formulas do not.

To the uniformed, the impression of an ERP at a manufacturing location is like taking a widget, adding some gadgets plus a few man hours and presto, you have a finished product. This is at best oversimplification and at worst a mathematically challenging extrapolation.

Why is scalability a challenge? Consider a scenario where you are preparing soup for a family of four. Something happens. Now you need to make soup for your neighborhood, maybe your city or even your county. Most people realize your raw materials will increase as you add people, but what about making your soup look and taste the same or ensuring your serving quantity is right?

To accomplish all of this requires software that can scale production while maintaining consistency in product composition. An ERP solution such as Microsoft Dynamics 365 for Finance and Operation can help categorize all your formulas based on parameters such as: weight, percentage, ingredients, production size, approvers, etc. Top executives have complete control of their manufacturing operations regardless of how many customers one product serves.

Creating New Efficiencies

In addition to providing consistent products regardless of batch size or manufacturing location, ERPs can help manage your formulas to create new levels of efficiency by:

  • Ensuring changes made to a formula have real-time implications to raw material procurement, production, inventory management and planning.
  • Scaling formulas regardless of production size.
  • Adjusting user fields to suit current requirements and configurations.
  • Keeping tabs on production costs such as raw materials, labor and other variables based on changes to your formula.

Conclusion

Most chemical manufacturers have a legal pre-defined volume to weight ratio for using certain ingredients. The process becomes more complex when using multiple measurement units of such as dry and wet volumes. Adding to the complexity are when different measuring systems are used, such as imperial in the US compared to metric elsewhere. The complexity increases when adding storage temperature or acidity of the ingredients into the mix. How will a particular chemical or ingredient react when it comes in proximity or contact with another agent? Will it lose effectiveness at a specific temperature?

An ERP’s formula management function allows companies to automate the production process. The integration process also means firms can publish relevant labels. These labels are pasted on the products providing required information.

Using FM in an ERP lets companies concentrate on the business of selling products. They can avoid the costs and headaches caused by an inefficient formula management process. Powered by a self-sustained connected ecosystem hosting a universe of business applications, Microsoft Dynamics 365 offers a secure and holistic formula management suite. Dynamics 365 ensures your formulas are secure, scalable, compliant and most importantly, strategically placed to elevate your organization to the next level of efficiency.

Scale up your manufacturing process with formula management, book a consultation with our expert to learn more.

Book Now

Mobile Devices, WMS Work Together to boost manufacturing efficiency

How Mobile Devices & WMS Work Together to Boost Manufacturing Efficiency

How Mobile Devices & WMS Work Together to Boost Manufacturing Efficiency 700 500 Xcelpros Team

Introduction

Using cellphones, tablet computers and other mobile devices in warehouses and on the factory floor gives executives another tool to improve manufacturing efficiency, especially in terms of inventory control. Mobile devices can:

  • Adapt to changing requirements
  • Track raw materials through the entire supply chain
  • Update data streams on a near real-time basis

Mobile devices like cell phones, tablets and other specialized devices, are becoming as common in the pharmaceutical industry as they are in our daily lives. Under the supervision of today’s chief financial officers (CFOs) and chief technical officers (CTOs), employees can use these devices to improve manufacturing supply chain efficiency, especially when it comes to inventory control.

Current handheld devices, ‘can provide full functionality and access to a company’s business systems without any sort of limitations’– Redwood Logistics

How do mobile devices help? By providing:

  • Increased productivity and responsiveness to customer requests by adapting on the fly to changing needs.
  • Regular Real-time data exchanges between workers and managers.
  • Geographic flexibility allows raw materials like active pharmaceutical ingredients and finished products to be stored closer to areas experiencing increased demand while moving materials from areas with decreased requirements.
  • Accurate location tracking on the road and inside a warehouse using smart devices’ built-in global positioning system (GPS) functions.
  • Reduced overhead through accurate, real-time, inventory tracking using barcode scanners to track everything from individual batches to large containers.
  • Reduced employee downtime.
  • Simplified training through consistent use of similar handheld devices and software that work regardless of the location. Employees working in Sudan and Southern California share the same devices and software.

Connected Mobile Devices vs. IIoT in Manufacturing

Mobile devices allow workers and managers to gather massive quantities of data but they lack one major function the industrial internet of things (IIoT) has: the ability to physically react to the information the sensors gather.

While mobile apps gather data, they can’t physically react to it. An employee needs to interpret that data and then react with the new information in mind. However, the IoT creates a proactive supply chain rather than a reactive one’ | Triskele Logistics

If, for example, a warehouse worker notices a critical active pharmaceutical ingredient (API) is at critical stocking levels, the worker must let a manager know, who then places an order for the product. An IIoT-equipped mixer, for example, may track the API storage level and place a reorder before the quantity drops to a critical level. Unlike with a mobile phone, human intervention is not required.

Mobile devices working with IIoT enabled machines permit the best of both situations: workers can remotely monitor machines and respond quickly when a problem occurs.

Using WMS with Mobile Devices

Some warehouse management software (WMS) works on mobile devices like phones and tablets, not just desktop and laptop computers. These systems help pharmaceutical manufacturers logically and effectively keep track of everything from raw materials to finished products, including the state of a given production run (e.g., finished).

When using the mobile app version of a WMS, warehouse workers can:

  • Print new barcodes and text labels and reprinting existing labels.
  • Start production orders and issue reports when a production process is finished.
  • Look up information on products stored elsewhere.
  • Perform one task that triggers a second. One example from Microsoft Dynamics 365 Warehouse Management System is receiving a purchase order that automatically generates a put-away order.
  • Perform a task triggered by a previous task, such as putting away the received materials listed on the purchase order.
  • Change batch disposition codes.
  • Transfer products from one location to another using the license plates.
  • View work available to specific users (requires a tablet).
  • Split work between two license plates when one is full.
  • Pick and pack items from a sales order into a single shipment.
  • Pick the oldest batches using configurable app software that can be set to Warn workers listing the oldest expiration dates or Force telling them there is an older batch to pick.

Using a Cell Phone or Tablet Camera

Warehouse workers need to input information into their mobile devices. Workers can painstakingly input product numbers into a keypad, risking problems when an error occurs, or they can scan barcode and QR codes.

Some firms prefer using dedicated handheld scanners. However, these devices may be restricted to proprietary WMS software that may offer limited functionality.

Cameras built into cellphones and tablets can be enabled for use as scanners. Users simply position the barcode within brackets on the screen and take a picture, automatically and accurately inputting the information into the portable device.

Improving Worker Efficiency With Barcodes and Scanners

A common scenario where mobile devices improve manufacturing efficiency is when a worker has a purchase order and receives several items with different quantities and warehouse locations. The worker scans the barcode. The mobile device, either cell phone or a tablet, tells them the quantity of each item and location where it goes, such as a warehouse section and bin number.

Depending on the WMS software configuration, the worker inputs the quantity and selects the measurement unit. They have the option of clicking ‘OK’ when everything matches up or clicking ‘Cancel’ when spotting a deviation.

Managers can also have the software configured to have workers confirm the required quantity is in the correct location. They have the option of confirming the purchase order or updating it to reflect a different quantity.

By the Numbers

Figure: 1Advantages of an Inventory Management System

 Advantages of inventory management system

The connected logistics market – an interdependent set of communication devices and the internet of things (IoT) permitting the sharing of data, information and facts with supply chain partners – was expected to grow by a factor of four from 2016 to 2021.

$10.04 billion – the connected logistics market in 2016.

$41.33 billion – the forecast connected logistics market in 2021.

32.7% the connected logistics market Compound Annual Growth Rate from 2016 – 2021.

Source: Markets and Markets Connected Logistics Market Report

Challenges to Using Mobile Devices

Off-the-shelf mobile devices used for supply chain management offer a host of potential benefits. They also come with some challenges. The main risks associated with them are:

  • Different designs: Cellphones are not designed with supply chain management (SCM) uses in mind.
  • Data Security: Data sent over the air using a wi-fi or Bluetooth connection is not as secure as when the data flow is done through a wired connection.
  • Durability: The majority of modern cell phones and tablets are not designed for the rugged, dangerous conditions of many factory floors.
  • Interoperability: Some smart devices may not be compatible with the company’s preferred WMS.
  • Obsolescence: Computer technology is constantly evolving. Today’s fastest device is tomorrow’s paperweight.
  • Cost: CFOs must budget for new devices and replacements for those damaged or destroyed in the course of business.

Summary

Cellphones and tablets are becoming increasingly popular tools alongside WMS on factory floors and in warehouses, offering businesses numerous benefits as the technology continues to mature. When combined with mobile versions of warehouse management software, these products:

  • Let workers stay on task and on target in terms of inventory control.
  • Provide workers guidance on picking the oldest items first.
  • Give managers an additional tool to improve manufacturing efficiency.

Take a step forward into digitizing your manufacturing inventory. Start your trial.

Schedule Call