Xcelpros

A Global technology and consulting services
Fraud and pharma inventory control tech reduces rip offs banner

Fraud and Pharma: Inventory Control Tech Reduces Rip-offs

Fraud and Pharma: Inventory Control Tech Reduces Rip-offs 700 500 Xcelpros Team

At a Glance

Making and selling fake versions of drugs for treating erectile dysfunction, high cholesterol, hypertension, cancer and other illnesses is big business.

  • $75 billion – $200 billion: The current annual revenue lost to counterfeiters
  • 13: The number of new drugs not produced in one year because of fake drugs

By the Numbers: Counterfeit Medicines

Reports by Outsourcing-pharma.com and Statista show just how much money counterfeit costs legitimate pharmaceutical manufacturers. Statista estimates the global market for fake drugs alone at $200 billion, accounting for 13 new drugs not being brought to market each year.

Other numbers of note include:

  • $100 billion – $431 billion: The estimated sales value lost to counterfeit drugs worldwide in 2020
  • 6–28: The number of new drugs not brought onto the market because of the effects of counterfeits through the impact on intellectual property rights
  • $103 billion (€92): The amount of money lost to European producers from 2012-2016 for counterfeit products including medicines
  • $19.45 billion (€16.5 billion): The amount lost to European pharmaceutical manufacturers, which was second only to clothing, footwear and accessories
  • 80,459: The number of pharmaceutical jobs affected by counterfeiters

Sources: Outsourcing-pharma.com, Statista.com

The National Crime Prevention Council has its own statistics on the cost of fake drugs:

  • 10%: The amount of all drugs in the global supply chain that are fake
  • 70%: The percentage of fake drugs in some countries
  • $75 billion: An estimate of global counterfeit drug sales from the Center for Medicine in the Public Interest quoted by the NCPC
  • 15,000: The number of illicit drug factories in India accounting for 75 percent of the world’s counterfeit drugs with other producers primarily in under-developed countries

Spotting a Fake

The Food and Drug Administration protects consumers from counterfeit medicines. “Drug safety and quality no longer begin or end at our border. The U.S. government works with foreign regulatory counterparts when possible to disrupt or close illegal operations involving the production and distribution of counterfeits,” the FDA states.

Figure: 1Identifying counterfeit medicine

Spotting a Fake pharma product

Identifying counterfeit medicine:

  • Packaging different that expected
  • New or unusual side effects
  • Medicine is available for purchase online

Resellers can protect themselves and their customers by only buying from authorized and licensed companies.

Resellers should also read the packaging. Potential fake products from unlicensed sources can be misbranded, adulterated, contaminated, improperly stored and transported, ineffective or unsafe, the FDA states. Some counterfeits have been spotted without a National Drug Code (NDC) number. Others have misspelled labels.

Among the medicines reportedly being copied and sold in the U.S. during the last five years are:

  • Symtuza ® from Janssen Pharmaceuticals (Dec. 24, 2020), used in the treatment of HIV
  • BiCNU ®, a cancer-fighting drug from Emcure Pharmaceuticals, Ltd.
  • Botox ® from Allergan
  • Cialis ® from Eli Lilly

Dangers of Using Counterfeit Drugs

Counterfeit drugs affect more than just legitimate companies: they harm people using them. Citing a 2017 World Health Organization (WHO) study, the OECD iLibrary states the effects on individuals of counterfeit medicines include:

  • Adverse—and possibly toxic—effects from incorrect active pharmaceutical ingredients
  • Ineffectiveness by not treating the targeted disease
  • Loss of confidence in health care professionals and health systems
  • Lost income by users from extended illness or death

The OECD report also referenced a 2019 Novartis in Society Report. Forensic tests of counterfeit medicine samples showing patients could be harmed by 90 percent of the counterfeits.

Fighting Counterfeit Drugs

Pfizer, one of the world’s largest drug manufacturers, supports the international “Fight the Fakes” campaign raising awareness of the dangers from using counterfeit medicines. Pfizer states that counterfeit versions of 105 Pfizer products were found in 113 countries. The company works with law enforcement agencies, wholesalers, pharmacies and others to increase inspection coverage, monitor distribution channels and use other methods to fight back.

One way pharmaceutical companies are fighting back is through the Drug Supply Chain Security Act (DSCSA). Enacted in 2013, the act requires manufacturers, contract manufacturers, repackagers, wholesale distributors and other meet compliance requirements.

A large part of this involves labeling.

For example, a warehouse receiving clerk can print labels after receiving raw materials but before putting them away.

Using Wave label printing, labels are available before workers run the work order on a mobile device. Workers then attach the labels during picking instead of after picking. Label printing options include:

  • According to the number of cartons on a single work line
  • With different sequences such as carton and pallet labels
  • Creating a unique serial shipping container code (SSCC) for each carton and including it on the label
  • Creating globally usable GS1-compliant numbers for bills of lading and SSCCs

Using Labels to Combat Counterfeiting

Among the labeling and packaging methods used to fight counterfeiting are holograms, 2-D barcodes, radio frequency identification tags (RFID) and packaging features that are either visible (overt) or hidden (covert).

NeuroTags, which makes these types of tags, states that it is easy for counterfeiters to make simple holograms and copy legitimate images. Luminescent topcoats revealing patterns and colors under special lighting are difficult to imitate, making it a good anti-counterfeiting solution for pharmaceutical products.

Smart Labels—also known as Smart Tags—have an RFID tag with a computer chip, antenna and bonding wires under a conventionally-printed barcode label. Among their benefits for the pharmaceutical industry —beyond being difficult to copy—is their ability to track temperatures. This is critical for some medications, such as the current Covid-19 vaccines from companies such as Pfizer and Moderna.

Another benefit of smart label technology is letting companies track items in real time. “It fulfills the requirement of tracking objects remotely, effectively, and most importantly at an affordable price,” Packaging Strategies.com states.

Combined with Microsoft Dynamics 365 Supply Chain Management, these types of labels make it difficult for counterfeiters to substitute cheap, ineffective and dangerous knock-offs for real medications.

D365 Supply Chain Management functions let companies track products from the moment raw materials arrive in the warehouse, through the production process and on to the sales floor.

Customers with equipment required to read the labels—and personnel trained in what to look for—will be able to distinguish legitimate goods from the fakes.

Summary

Counterfeiting pharmaceuticals costs the industry billions every year. It affects not only sales profits but intellectual property rights. Combining different types of labels such as Smart Tags with inventory tracking software lets pharmaceutical manufacturers know when real goods arrive at their destinations. It also lets them know when someone along the supply chain stole their products and replaced them with fakes.

Get a consultation to learn about pharmaceutical industry fraud.

Schedule Call

Clean Your Bad CRM Data & Boost Efficiencies: Best Practices

Clean Up Your CRM Data & Increase Efficiency

Clean Up Your CRM Data & Increase Efficiency 700 500 Xcelpros Team

At a Glance

Sales teams around the world rely on Customer Relationship Management (CRM) systems to drive sales force automation. Bad data or “dirty data” prevents companies from gaining the benefits of a CRM system. It causes revenue losses while risking damage to your brand reputation through incorrect messaging and lack of targeted marketing.

  • 15% of companies have confidence in the quality of their CRM data
  • Poor quality data costs US businesses $3.1 trillion per year, IBM estimates
  • Eight out of 10 companies surveyed stated that bad CRM data had a significant impact on lead generation campaigns and industry outreach
  • A data quality initiative can boost sales by 20% – 40% while reducing IT costs by 40% – 50%

An overview of CRM and Customer 360

Today’s Customer Relationship Management (CRM) solutions are a lot more than just salesforce automation or contact management tools. CRM systems are being leveraged to run Sales, Field Service, Customer Service, Project Service Automation, Marketing, internet of things (IoT), call records, emails and more.

CRM is now at the core of every aspiring company. They can capture and present a 360 degree view of customer interactions in real-time. Different departments within your organization can benefit from this single source of truth. Embedded Analytics tools assimilate data from different data sources such as ERP, Big Data, Social Media, Email interactions and aid in building this 360 degree view. It is imperative to plan for and include Data Quality Management (DQM) processes and tools while managing such critical data.

Fig 1: Customer 360

One Customer’s Story

One of our customers decided to migrate to Microsoft Dynamics CRM. They immediately saw their data quality was bad and required extreme manual intervention. The clean-up initiative was a nightmare lasting several weeks requiring 10 full-time people to clean three years worth of dirty data.

Among the questions this client asked were: “Are there any tools that can help automate this clean-up? Is this some kind of prehistoric CRM?” This is more common than you might think.

Only 15% of all companies are confident in the quality of their CRM data. This customer was using a good CRM solution equipped with powerful data-cleanup tools. So why weren’t these tools used? According to the customer, they were.

A major reason for the dirty data was some technology-averse users recorded data inconsistently and used fields for incorrect purposes. Enforcing good data capture processes would have eliminated these issues.

This customer’s database includes more than 30,000 leads in the system. About 10% are duplicates. Roughly 20% of the remainder have problems such as:

  • Leads (people) not with the company
  • Missing email and contact information
  • Missing revenue details
  • Missing customer feedback

Consequences

All of this dirty data delayed marketing campaigns for key events, costing revenue. Current leads are at best “unknown” causing missed sales and opportunities and adding stress to the sales and marketing teams.

Some Truth

This customer isn’t the first to have these problems. Many of our customers suffered similar ordeals resulting in lost opportunities and revenue earning potential.

How did data get this dirty, and most importantly, what are the lessons learned?

A few of the many ways that a CRM system can go from a super valuable tool to an expensive headache are:

  • Improper training
  • Years of incorrect processes when capturing data
  • Failing to perform due diligence when selecting specific fields
  • Careless typos
  • Lacking an embedded data quality management

These recurring issues can be addressed proactively by active management.

Why is CRM data critical for companies?

The success of an organization relies on a constant flow of smart data-driven decisions. This creates the question: “How do you make the right decisions to ensure organizational growth?”

Among the environmental challenges facing chemical and pharmaceutical firms are setting and meeting public targets for greenhouse gas (GHG) emissions in-line with the 2018 Intergovernmental Panel on Climate Change (IPCC) report.

High-quality information and strategy are the pillars of any objective decision taken within an organization. Imagine the impact of incomplete or unreliable CRM data—a significant element used by sales and marketing departments—on marketing campaigns? Lead conversions and other metrics cannot be calculated because of bad data.

A CRM solution with unreliable data is similar to buildings without foundations. Just as a building can’t stand without its foundations, a customer relationship management system can’t deliver intended value to businesses without up-to-date, high-quality, reliable information.

Poor data quality costs organizations an average of $9.7 million per year. Source: Gartner Research

$3.1

Trillion amount of loss being incurred by US-based businesses annually due to poor quality data.

Source: IBM

How to Identify dirty data

Dirty data or bad data refers to information with incorrect facts or assumptions. It can exist anywhere —in your CRM, ERP, shared documents, reports, etc.— and it’s usually a specific type of error or simple mistake.

According to Techopedia: misleading data, incorrect data, inaccurate data, duplicate data, non-integrated data, misspelled data, non-formatted data and incomplete data fall within the category of dirty data.

Some definitions are:

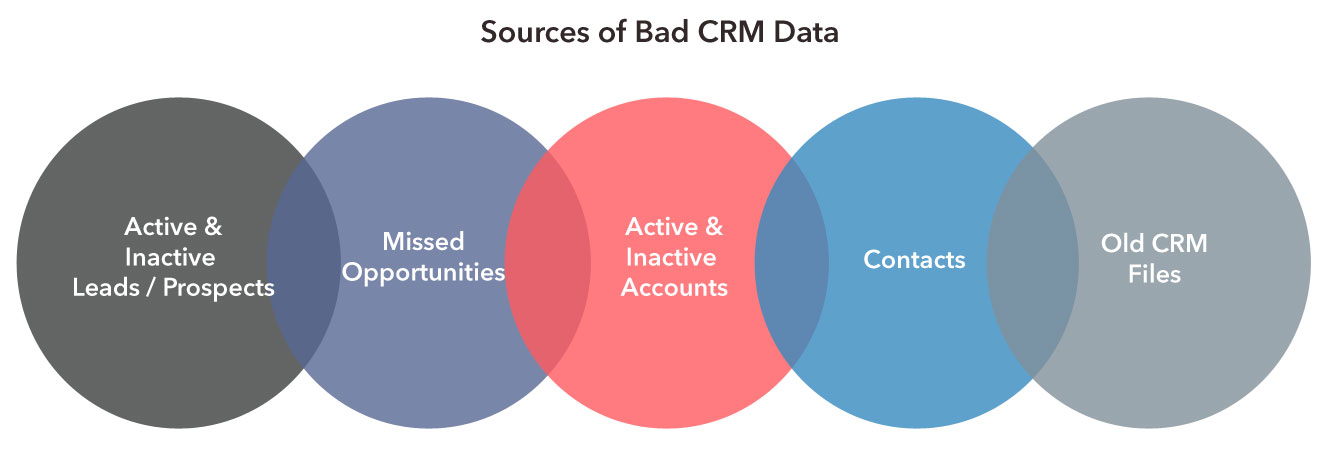
Sources of bad CRM data

  • Invalid Data: Information that is inserted in wrong fields, records that cause software errors or unusable information from improper formatting.
  • Fraudulent Data: Intentional insertion of wrong information by users or sophisticated CRM bots designed to adversely impact a company.
  • Duplicate Data: Records of the same customer under various pseudonyms and accounts input by user error.
  • Inconsistent Data: Data redundancy in the system that when left unchecked, causes greater problems.
  • Outdated Data: CRM data that was valid years ago but was not updated or is no longer required.
  • Incomplete Data: Records that don’t contain important information requiring additional material to make it functional.

The Cost of Dirty Data

Many companies overestimate their quality of data and at times even ridicule any chance of dirty data attack to their business. This often causes significant losses in business.

Consequences of bata CRM data

  • Companies can’t afford to ignore their CRM data quality.
  • Companies need an effective approach to data quality management when they want to convert bad leads to viable customer opportunities.
  • Implementing a Data Quality Management initiative can boost sales by 20% – 40%.
  • IT spending can be reduced by 40% – 50%.

Bad data costs U.S. companies $3 trillion a year. Most organizations lose $14.2 million a year. Source: data-axle.com

How bad CRM data impacts a business

Bad data cost businesses a minimum of of their revenue, which reached as high as 25% in some cases. – EXPERIAN | 2017

Dirty CRM data is a plague that should be eradicated. Its impact on a single business can be staggering. Drawbacks to having and using outdated, inaccurate or just plain bad data include:

  • Increased maintenance costs and resource utilization
  • Lower customer satisfaction and retention
  • Increased errors in messages and emails, resulting in spam reports and potential fines of $16,000 for each email sent in violation of the CAN-SPAM Act
  • Prolonged sales cycles heightening costs
  • Reduced productivity and performance
  • Affected sales and distribution channels due to inaccuracies
  • Non-compliance issues resulting in regulatory penalties
  • Damage to reputation and a decrease in revenue generation

Impact of bad CRM data on sales

Any one of these effects is bad news for a business. Dirty data can create many of them at once.

Figure: 1Impact of Bad Data in all Areas of the Enterprise

Impact of bad CRM data on Enterprise

The typical organization invests roughly $150,000 to generate 1,000 leads.Of these leads, only 30% are typically routed to sales and 700 leads are left behind. This translates to the company losing millions of dollars in pipeline opportunities– Carlos Hidalgo, Founder & CEO of VisumCx

Data Failures are Expensive

Data failures can happen to any organization big or small causing serious damage. The cost to repair a company’s reputation can be in the millions. Fines and penalties for legal violations are already steep, and will continue to rise.

For example, the Fleet Bank set out to deploy a $38 million CRM project in 1996. The project failed to meet its objectives for three straight years, leading to a complete failure, TDWI reported.

  • A large insurance wasted thousands of dollars on a campaign from duplicate records in its list of mail contacts.
  • Erroneous data entry prevented bills from being sent, costing a major telecommunications company $8 million in one month.

Risks due to bad CRM data

A global chemical company’s failure to identify and reconcile with global suppliers cost it millions in lost volume procurement discounts. The average cost of fixing and cleaning a single, duplicated data record can range anywhere from $20 – $100.

Prevent Dirty Data with Data Quality Management

Multiple data challenges

Most organizations don’t have a data quality management strategy in place. A minimum amount of planning would enable these organizations to design a suitable data quality management (DQM) plan. A DQM plan ensures that the information gathered within a developed long-term business strategy is properly maintained. Such a plan prevents interruptions to day-to-day operations. Among the topics the DMQ looks at are:

  • Accuracy: Is the information correct and can it be validated?
  • Integrity: Is there a coherent, logical data structure?
  • Consistency: Is the data consistent and easily understood?
  • Completeness: Does it provide all the information required?
  • Validity: Does the data fit within the business’ required parameters?
  • Timeliness: Is it available whenever required?
  • Accessibility: Can the data be easily accessed and exported to other applications?
  • Compliance: Does the information comply with regulatory and industry standards?

It’s time to Clean Your CRM Data

Data decays at an average rate of 2% per month or up to 25-30% per year. Losing any of this data often results in lost opportunities. Cleaning this data lets your marketing efforts reach prospects faster, helps target the right audience, increases revenue from campaigns and eliminates wasted time and labor.

So how can a company achieve this? What are some ways to prevent dirty data?

ways to prevent dirty data

  • Regularly update complete customer information: Train the sales and marketing staff to gather all essential data during their customer contacts.
  • Integrate other systems with the CRM solution to update purchase order details and customer payment status levels. This helps keep customer details current.
  • Maintain records. Stored information becomes stale in the database when it is unused or administrators have not actively managed it. Confirming customer information at every contact helps prevent this. Another option is hiring professional database cleaners to keep the CRM data current.

Other methods include:

Setting a data quality policy. Management can hold CRM data input training sessions while using a comprehensive data management policy to guide employees.

Automating data entry to avoid incorrect data insertion and duplication using software that automatically captures and logs information. When manual entry is the only option, check what’s been input for spelling and grammatical errors.

  • Ensuring only clean data is entered into the CRM database

Clean CRM Data Creates Successes

With a little planning and by having the right processes in place to follow, a company can turn its CRM into the organization’s financial heartbeat. Businesses of any size can benefit from keeping clean data.

For example, Schwan Food Company’s parent firm was greatly impacted by invalid customer records leading to delays in delivery. Customer service representative efforts to satisfy complaints were wasted. The company placed a concentrated effort on eliminating duplicate CRM data. This generated a quality data management solution removing duplicate customer records and establishing a 360-degree view of the customer. The result was better customer service.

After a merger, MSC Industrial Direct Co. – a Forbes Platinum 400 company – discovered its business workflow was being affected by duplicate customer record entries, causing compensation issues within sales. To resolve this, the organization implemented a business-insight driven data management solution that removed duplicate customer records while minimizing credit risk exposure.

How to reap benefits from CRM data

Use Dynamics 365 Rules to Keep Data Clean

Microsoft Dynamics customer engagement apps (Dynamics 365 Sales, Dynamics 365 Customer Service, Dynamics 365 Field Service, Dynamics 365 Marketing, and Dynamics 365 Project Service Automation) automatically detect several types of duplicate records. These include: accounts, contacts and leads.

Companies can use Dynamics 365 to clean data by having authorized users—systems administrators and above—create new rules to avoid duplications in other fields. They can create a new duplicate detection rule or edit an unpublished one.

The process starts by selecting a base record type and then a matching record type plus criteria such as “Exact Match.”” The people setting these rules can also exclude inactive matching records, be case sensitive, ignore blank fields and adjust other settings.

These Microsoft D365 apps have a limit of five rules for the same base record type.

Key Takeaways – Move Forward Plan

Employees of some companies take a casual approach to entering CRM data, which often results in incomplete records. Three years later there are thousands of garbage leads and contacts in your CRM. They lack a quick way to fix the data errors and cannot run campaigns until the mess is sorted.

Keeping a CRM free of dirty data CAN be done with a little work. Having the right processes in place will minimize the amount of dirty data. Your sales and marketing teams can take advantage of an immensely valuable technology.

Cleaning dirty data is admittedly a time-consuming affair: don’t ignore it. The effort you spend on cleaning your CRM is worthwhile. The effort you spend keeping data clean will lead to major growth and a positive change in your day-to-day operations.

Get a assessment to learn best ways to manage your CRM data & increase the efficiency of your CRM.

Get Started

Enhancing Chemical Plant Operations to Make it Smart Factory Ready

Enhancing Chemical Plant Operations to Make it Smart Factory Ready

Enhancing Chemical Plant Operations to Make it Smart Factory Ready 700 500 Xcelpros Team

Enhancing Chemical Plant Operations to Make it Smart Factory Ready

Creating an Industry 4.0 smart factory requires time, planning, money and employee buy-in. Companies are advised to develop a road map showing what they want to do before they start. Converting an existing factory to a smart chemical plant requires time, effort, money and patience. Organizations will undoubtedly face barriers on the way to achieving their goals. For more information see the full article here.

Get a consultation on transforming into a smart chemical factory.

Get Started Now

Major Challenges for Chemical Companies

Major Challenges for Chemical Companies

Major Challenges for Chemical Companies 700 500 Xcelpros Team

Introduction

Government regulations, trade wars, blocked shipping ports and more than 4.43 million dead worldwide as a result of Covid-19 are sure to make the rest of 2021 a difficult year. For organizations in the Chemical industry, these challenges include:

  • Ongoing global transportation disruptions
  • Reducing greenhouse gas emissions and meeting climate change requirements
  • Refining the definition of per- and polyfluoroalkyl (PFAS) “forever” chemicals
  • Increasing commoditization of chemical products
  • Rising trade tensions caused by feedstock supply disruptions
  • Integrating acquisitions to release promised synergies and onboard new revenue sources
  • Reducing complexity and streamlining workflows across the globe
  • Rapidly entering and winning new markets

Sources: Deloitte, C&EN, CNN, McKinsey & Company

Ongoing Shipping Disruptions

Shipping ports, especially those in China, have been dealing with backlogs and delays since the start of the pandemic. Today, these problems still continue to display. For example, the Ningbo-Zhoushan Port near Shanghai was shut on Aug. 11, 2021 after a dock worker tested positive for Covid-19. This is the world’s third-busiest port and affects Yantian, which closed in June after coronavirus infections were found in dockworkers before gradually reopening. Also affecting the chemical and pharmaceutical supply chains are container shortages, factory closures in Vietnam and after-effects from the week-long Suez Canal blockage earlier this year, CNN reports.

“We currently expect the market situation only to ease in the first quarter of 2022 at the earliest,” Hapag-Lloyd shipping company chief executive Rolf Habben Jansen told CNN.

Delays and container shortages are contributing to much higher shipping prices. Drewry Shipping in London said the composite cost of shipping a 40-foot container on eight major East-West routes was up 360% ($9,613) the week of Aug. 19.

All of these issues impact deliveries to and shipments from US ports. In August, 36 container ships were anchored off Los Angeles and Long Beach alone. Normally there would be none or one, CNN stated.

Backlogs at these main ports often lead to delays at air terminals, overstocked warehouses and thinly stretched logistics networks.

Environmental Concerns are Taking Their Toll

Shipping delays aren’t the chemical industry’s only headache. Increased government regulations designed to reduce greenhouse gas emissions, particularly carbon dioxide (CO2), is another pain point. Add in the effects of chemical industries on the environment plus hazardous material control and it’s easy to see the industry is facing challenges on several fronts.

Among the environmental challenges facing chemical and pharmaceutical firms are setting and meeting public targets for greenhouse gas (GHG) emissions in-line with the 2018 Intergovernmental Panel on Climate Change (IPCC) report.

The report’s goal is persuading all industries—and all countries—to cut CO2 emissions by 45 percent from 2010 levels. According to a C&EN report, the largest number of 25 companies surveyed are looking at a 35% reduction from 2010 levels. The largest firms—Dow, DuPont, Eastman Chemical, Mitsubishi Chemical and others—are looking to become carbon neutral by 2050.

Figure: 1Annual carbon dioxide emissions

Annual carbon dioxide emissions

Carbon dioxide is the biggest issue but not the only chemical contributing to global effects of chemical industries on the environment. PFAS “forever chemicals” are also causing problems. They include the toxic perfluorooctanoic acid (PFOA) and a chemical formed by hydrolysis from its replacement, hexafluoropropylene oxide dimer acid (HFPO-DA).

Figure: 2PFAS Chemicals findings in New Jersey

Image: PFAS Chemicals chain reaction

Both are dangerous and long-lasting. Chemical companies around the world are looking for ways to address the handling of both substances.

Business Effects of a Changing World

A McKinsey & Co. report noted that in 1970, about 10 percent of the world gross domestic product (GDP) was in India and China. The two countries alone represent about 36 percent of the world’s population. Fifty years later, China alone represents 30 percent of the chemical demand and supply right now. That number is rising and could top 40 percent, the report warns.

Combined with the continuing U.S. – China trade war and the effects of Covid-19, “regulation and geopolitical considerations may be much more relevant factors than what management teams have experienced in the past,” the report warns.

Many of these issues are forcing businesses to change how they work. Flexibility in terms of partnerships, cooperation, broadly designed research programs, and the design of smaller and more flexible production units will increase over time, McKinsey predicts.

One way of meeting these challenges, and countering the pitfalls is through technology.

Using Tech to Combat Challenges

Technology in the form of artificial intelligence, “can provide incremental and relevant benefits” in terms of asset and commercial productivity, the McKinsey report states. Four key areas where AI can help chemical companies include:

  • Dealing with large data sets, such as production, marketing and sales plus research and development.
  • Providing earlier access to real-time information to let decision makers respond more quickly than the competition.
  • Increasing performance transparency around equipment and employees, such as chemical specialties. The transparency will help educate shareholders on the companies’ performance.
  • Boosting process automation in terms of scale.

Labeling and Regulation Compliance

Today’s enterprise technology, specifically Microsoft Dynamics 365 Supply Chain Management, has the ability to generate labels in accordance with current FDA requirements.

These labels allow organizations to track materials throughout every step of the supply chain. For example, barcodes scannable by cellphones and other handheld devices can ensure temperature-sensitive raw materials are properly stored. They also can keep track of expiration dates, letting warehouse managers know which items need to be shipped out first.

Enterprise Resource Planning (ERP) products such as Microsoft Dynamics 365 (D365) let chemical and pharmaceutical companies avoid compliance mistakes. How? By creating and constantly updating a large database stored in the cloud. With real-time data access, one that can be modified to include alerts showing when a part needs replacing or the stock of a particular precursor chemical is running low, companies can ensure quality standards are met. Keeping accurate track of production processes also lets them provide regulators with required data.

One Xcelpros product specifically created for the chemical industry is Integrated Chemical Management (iCM). Working with D365, iCM includes integrated systems, infrastructure for the maintenance and distribution of Safety Data Sheets (SDS) and compliance with globally harmonized system (GHS) label requirements.

Integrating with D365 Finance and Operations iCM benefits include:

  • Removing the cost of integrating with third-party labeling and SDS systems
  • Providing consistent SDS and label data management
  • Reducing the total cost of ownership by removing the need to maintain product safety documentation and data in-house

In addition to Xcelpros’ iCM, some D365 programs also accept AI modules. Working with internet of things (IoT)-enabled production machines, they provide decision-makers with critical business insights that can help them overcome today’s many challenges.

Summary

AI is just one digital technology that can help chemical companies meet increasing environmental and safety regulations. This same tech lets companies diversify their supply chains, bypassing some of the worst shipping bottlenecks or finding closer suppliers.

Using AI to generate barcode labels for everything from individual products to license plates for pallet loads is one of the key features of D365. Labels produced in D365 can provide electronic readers with everything from the chemical composition of a product to its expiration date. This makes labeling one of the most important FDA compliance requirements. Being able to fully track materials, including finished products, is another.

Book a consultation with our technology experts and learn how to strengthen your chemical company resilience.

Book Now

References: The state of the chemical industry: it is getting more complex 

Standard costing in pharmaceutical manufacturing banner

Standard Costing in Pharmaceutical Manufacturing : Industry Challenges & Solutions

Standard Costing in Pharmaceutical Manufacturing : Industry Challenges & Solutions 700 500 Xcelpros Team

At a Glance

Costing methods for pharmaceutical manufacturing, especially the standard cost method, can significantly help reduce hidden costs.

  • On average, 30% of costs go undetected due to poor business practices and the inability to detect them.
  • Improper habits of recording data can be a major culprit in accumulated hidden costs.
  • The Standard Cost Method provides a simpler solution, offering insights into daily cost, cost variance and profitability analysis for pharmaceutical manufacturing companies.

Introduction

Forecasters are projecting more opportunities for mid-market pharmaceutical companies operating in the US. These opportunities will require more streamlined processes within pharmaceutical manufacturing and contract development and manufacturing organizations (CMOs and CDMOs). The most recent projections included the following:

  • The global medicine market is expected to top $1.4 trillion by the end of 2021, Grand View Research states. Anticipated spending on medicine in the U.S. alone is expected to grow to $655 billion at a rate of 4% – 7% by 2023. followed by pharmerging countries —emerging nations in areas such as Africa and parts of Asia—hitting $385 billion (5% – 8% compound annual growth rate) and the top five European countries at $225 billion (1% – 4%). Japan will either lose 3% or stay even, a report from the IQVIA Institute for Human Data Science notes.
  • Rising research and development (R&D) costs are being accompanied by more stringent testing requirements.
  • American companies introduced 138 new chemical or biological entities (NCEs and NBEs) between 2016-2020, according to Statisa.com. Europe produced 64, Japan released 38 and the rest of the world generated 48 for a total of 288 during that span. This compares to 226 from 2011-2015 and 146 a decade earlier, IFPMA states.

Figure: 1Global Pharmaceutical Market sales in 2019

Global Pharmaceutical Market sales in 2019

Change Accounting Methods

Adapting to these changing market dynamics requires changes in accounting across the pharmaceutical industry. Companies will need to become more sophisticated when it comes to their methods of costing, profitability analysis and production variance calculation and reporting.

A few ways to achieve these goals include standard costing methods, following best practices and optimization within a pharmaceutical batch manufacturing company. Also fairly critical in today’s highly-regulated environment will be much more accurate reporting of data.

The Never-Ending Challenges of C-Level Reporting

Determining the overall profitability for a product is a major concern for any C-Level executive. Calculating cost structure in the pharmaceutical industry is especially tough to determine when it involves fast-moving raw materials, labor, overheads and other indirect costs.

For pharmaceutical companies, one prime objective is following standard operating procedures (SOPs) in adherence with the FDA’s compliance reporting rules. In the past, companies have placed so much focus on staying compliant it becomes easy to lose sight of key indicators that drive profitability and organizational goals.

In continuous production and batch manufacturing processes, the multitude of activities involved requires costing for each activity. This can be tough as many moving parts make it hard to identify the right cost breakdown structure. Despite the difficulties, companies must measure true costs for stakeholder reporting.

True costs vary from those assigned by traditional cost-accounting methods by 30 to 100 percent.Source: -Per McKinsey

What matters to the CFO?

CFOs don’t look at a single product or product line. Instead, they often prefer a much broader view when determining what matters the most, like the details needed to determine actual costs and how any variances came to be.

Since the manufacturing process is so heavily intertwined with product costing, the need to highlight different elements that aid in standard cost determination and variance reporting becomes even greater. Some reporting structures use backflush costing methods to delay costing until an item is manufactured. This can be a reporting nightmare when it comes to analytics and production performance metrics.

It’s common for some people to analyze these costs and variances using things like Microsoft Excel spreadsheets with complex macros and v-lookups. Analyzing true costs this way is extremely challenging, especially when your system doesn’t keep track of perpetual costs until the completion of a production job.

Data Capture Discipline and Lost Visibility

Longer production campaigns in continuous processing can have individual processes taking days, weeks or sometimes months. Recording actual numbers based on material and resource consumption to report standards compared to actuals becomes tedious. Enforcing process discipline is one way to help streamline this part of the job.

Gaining clarity and determining actual costs can take hours of data crunching, the process becomes harder and more complex when you take into account any reworked batches or lots. All the different moving parts of reworked jobs can make it tough to determine the additional cost of starting materials, line clearance, labor and machine hours that get compounded to the original batch cost.

Human capital, machine or work center hours need to be planned across multiple production jobs. Proper planning helps accurately source and schedule labor while allocating machines to each production run.

5%

High-performance pharmaceutical companies have about 3% of rework products when compared to the average companies that have about 8%

Source: -Per McKinsey

People and Processes Impact Costs and Profitability

A large amount of time and resources are spent trying to recover inefficiencies caused by following improper procedures in day-to-day operations. These inefficiencies may be due to the lack of any properly identified key performance indicators (KPIs), processes or methods to track efficiencies.

Understanding the total cost of each batch helps proactively plan for producing other similar “A” grade items. The Production Planner cares less about cost and more about capacity roadblocks. They want to know how additional material and resource requirements could lead to unplanned downtimes.

Warehouse operators need to record consumption. Their figures are based on when Quality Control (QC) tells them to proceed with the job, how much to consume on the batch and how many hours were already recorded. CEOs want to know if the operators have systems and processes in place to capture critical data in real-time.

Many equipment operators tend not to record data during operations, waiting instead till the end of the production run to capture any data.

Production managers constantly look for ways to substitute materials to meet timelines, quality standards and batch potency, all while following existing company rules. At the same time, they need to accurately record batch data. Using Internet of Things (IoT) sensors that capture this data as it occurs in real-time and feed it directly into the ERP system provides this accurate, continuous data flow.

Batch Manufacturing – An Example

Some long-running batch manufacturing processes require hourly quality control tests. Depending on the PH values and other data, operators add chemicals and make other changes to achieve the desired results. From a cost accounting perspective, the quantity of materials consumed from inventory may not be recorded. This causes inventory records to become out of sync and inaccurate. Not knowing what and how much is used may cause a controller to categorize these additions as overhead costs.

Some practical solutions to ensure materials added during ongoing production testing are accurately recorded include:

  • Having an industrial grade tablet or mobile device on the shopfloor to aid in data capture. Products and quantities are captured when operators have the time to input them.
  • A more accurate method uses IoT sensors that tracks starts, stops and inputs within each tank. IoT sensors can also generate an alarm when deviations occur.
  • Barcode readers and scanners are also helpful in capturing product use data on the shopfloor, and can be easy to operate.
  • Training staff on simple new production processes helps ensure every team is performing the right task at the right time.

Tracking electronic signatures helps ensure the right people are performing each process and can help prevent incorrect practices.

High-Level Production Process

High-Level Production Process

Standard Cost Calculation

How are standard costs determined in a sophisticated mixed-mode manufacturing ERP system, where process manufacturing and discrete processes occur within the same operation facility? These costs are derived from standards set on the formula or build of materials (BOM) depending on a combination of the:

  • Batch being manufactured
  • Contents of each container
  • Hours spent on each operation
  • Standard resource costs per unit price

The calculated cost of materials using a formula or a BOM is derived from individual raw materials or intermediate costs. The cost of operations comes from resources and machines assigned to the task.

Past history helps set accurate standards to proactively manage production runs and accurately record production costs.

C-level executives tracking profitability and plant managers whose bonuses depend on higher margins are constantly looking to reduce redundant spending caused by operational and resource inefficiencies.

Figure: 2Standard Costing Formula

Standard Cost Calculation

Standard Cost Calculation Results

What Should Happen When Estimating Production Costs

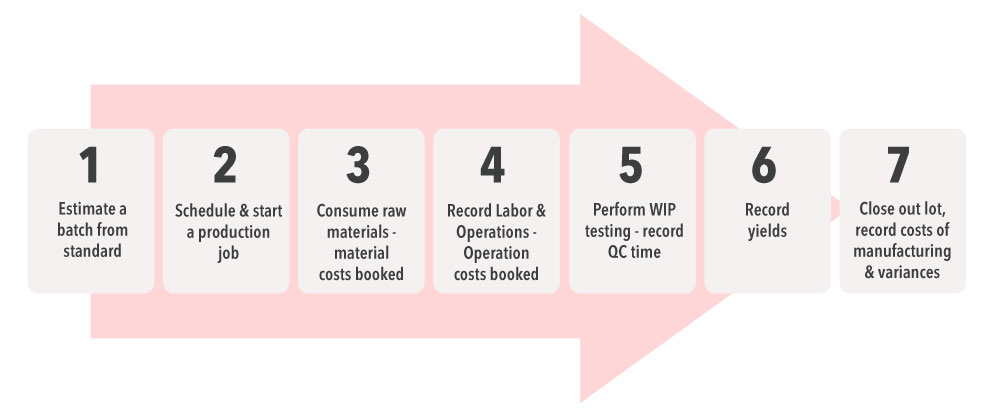
The first step in estimating production costs is planning the size of each batch. Your ERP system should automatically scale from the standard batch size and identify the standard cost. Using the ERP data provides an insight on other decisions about the batch such as identifying the right margin and setting an appropriate selling price. These figures can appear on customer quotes and sales orders.

As production jobs are released to the production floor, operators allocate all appropriate raw materials for consumption. When this happens, a good inventory tracking system such as that in Microsoft Dynamics 365, marks those specific raw material lots as unavailable for other batches.

Allocating raw material lots and resources correctly and timely recording data in a modern Pharmaceutical ERP has benefits. They include controlling unnecessary mistakes and coverups, providing a true picture of product costs.

Standard Cost Rollup

The standard cost rollup for a manufactured product is made up of direct material, direct labor, overhead and indirect costs.

Following actual raw material consumption, there is a tendency to not record point-in-time information for fear of making mistakes or making errors while not tracking what was altered from standards and causing a variance.

The Consumption Process

During raw material consumption, physical inventory is relieved by directly booking material costs to Work-In-Process (WIP). If we were to assume that the only changes on a production run is to the overall labor and machine time on operations, then all standards relieved from WIP would book production and quantity variances based on standard.

raw material consumption Process

Using a Multi-Tier Formula or BOM

A more complicated scenario occurs when there is a multi-tier formula. The production produces intermediate products that are then used in the next tier. Additional raw materials are added. This process continues until the product is finished, in some situations, yields are tallied before moving to the next step.

In others, the shop floor goes by standards, recording adjustments to materials and operations after the final finished lot is produced. In this scenario, all tiers in the multi-tiered process are only closed at the end. This process can cause a complicated cost calculation considering all the elements involved plus any variances.

Multi-Tier Formula or BOM for Production Process

Key Takeaways

With proper record keeping and accounting methods, it’s possible to streamline operations and reduce or eliminate unpredictable variances. If you’re not sure where to start, these three steps will help.

  1. 1.Examine your current manufacturing practices and calculate their downstream impact on costing.
  2. 2.Understand how competitors outperforming the market are becoming more efficient.
  3. 3.Identify different methods to improve both productivity and worker efficiency.

Organizations can take advantage of ERPs like Microsoft Dynamics 365 to help pinpoint areas for improvement and focus on company goals. It includes production cost buckets including quantity, substitution and lot variances.

Contact Xcelpros to learn more. Xcelpros loves to show customers how they stand to benefit from the sophisticated analytics and business intelligence tools embedded within D365’s Finance and Supply Chain Management systems. These tools provide the necessary insights to grow and stay ahead of the market.

Get a Consultation to learn how to improve standard costing in pharmaceutical manufacturing.

Get Started

References: Pharmaceutical manufacturing market 

Challenges of pharmaceutical supply chain banner

Top 8 Challenges of Pharmaceutical Supply Chain in 2025

Top 8 Challenges of Pharmaceutical Supply Chain in 2025 700 500 Xcelpros Team

Top 8 Challenges of Pharmaceutical Supply Chain in 2025

Pharmaceutical supply chain challenges have been a major cause of concern for the industry throughout 2020. The challenges are still very much prevalent, even as the world moves ahead in the era of the new normal. 2021 will probably push the pharmaceutical supply chain to its limit. With the right strategy, technology and solutions, however, the pharmaceutical sector can undoubtedly rise to the occasion. For more information see the full article here.

Take a assessment to get recommendations in transforming your pharmaceutical supply chain.

Get Started Now

latest trends in pharmaceutical manufacturing industry banner

Latest Trends in Pharmaceutical Manufacturing Industry 2021

Latest Trends in Pharmaceutical Manufacturing Industry 2021 700 500 Xcelpros Team

By the Numbers

In a July 2021 report, Grand View Research estimated the 2020 global pharmaceutical manufacturing market value at $405.52 billion. Key metrics include:

  • 11.34%: The industry’s expected compound annual growth rate (CAGR) from 2021 – 2028
  • $957.59 billion: The revenue forecast for 2028
  • 77.95%: The retail segment market share in 2020

The IQVIA Institute for Human Data Science used a five-year estimate from 2018-2023 in its 2019 report. This report estimated spending on medicine to top $1.4 trillion by the end of 2021. Looking ahead to anticipated global medicine spending and growth in 2023 shows the top individual regions in terms of spending and 5-year CAGR as being:

  • United States: $625 – $655 billion, + 4% – 7%
  • Pharmerging: $355 – $385 billion, + 5% – 8%
  • Top 5 Europe: $195 – $225 billion, + 1% – 4%
  • Japan: $89 – $93 billion, – 3% – 0%

“Pharmerging” is a term given to emerging nations in areas such as Africa and parts of Asia.

Figure: 1Estimated medicine spending by companies in 2023

Estimated medicine spending by companies in 2023

Figure: 2Estimated growth rate of medicines by 2023

Estimated growth rate of medicines by 2023

5 Topics to Ponder

Despite all the problems and deaths caused by Covid-19, along with its impact on pharmaceutical manufacturing and the U.S. trade war with China, the market for medicines and related products is staying strong.

Looking several years out, one question CEOs and CFOs must ponder is what changes can we make now to prepare for a profitable future?

According to The Medical Futurist, the Top 5 trends for leaders to consider in the coming years include:

  1. 1.Using artificial intelligence to speed research & development. Spending on AI in healthcare alone is expected to hit $31.3 billion by 2025.
  2. 2.Empowering patients to aid in drug design and advisory boards. TMF notes the Food and Drug Administration has its own patient engagement advisory committee. The FDA states the committee considers different topics including the design of clinical investigations, communicating device benefits and risks, digital health technology and more.
  3. 3.Conducting experiments using computer simulations or “in silico,”. This is another digital trend in pharmaceutical manufacturing. This method eliminates animal testing and side effects on humans and animals. So far, this technology is less than halfway to becoming a reality, though.
  4. 4.Boosting the supply chain with technology such as blockchain to enhance security and improve inventory tracking. “Counterfeit drugs might make a cheaper alternative but are the cause of tens of thousands of deaths worldwide while the fake drug trade continues to be a profitable multi-billion dollar business,” according to TMF.
  5. 5.Using technology to appeal to more providers and payers. TMF mentions a wearable monitoring device and an app for feedback from doctors plus the app itself. Another technology is 3D printed pills such as Spritam that gained FDA approval in 2015.

Another topic mentioned in a different report is using real-world-evidence (RWE). A 2018 report by Deloitte defines RWE as, “clinical evidence about a product’s usage, potential benefits and risks derived from real-world data.”

However, Deloitte’s survey also highlighted three potential barriers to RWE adoption by pharmaceutical companies:

  • 75 percent: Major lack of receptivity by external stakeholders
  • 70 percent: Lack of understanding by internal stakeholders
  • 65 percent: Lack of access to necessary external data

AI and ERPs

Enterprise Resource Planning (ERP) software such as Microsoft Dynamics 365 Finance can support different AI modules, as needed. Depending on a business’ requirements, AI can help conduct research more efficiently, automate manual processes and perform other repetitive tasks.

AI benefits researchers through natural language processing and reasoning, learning from data and optimization addressing problems. One example cited by the Royal Society is using “deep” neural networks to identify features required to solve problems. Another uses reinforcement learning to examine many scenarios and assigning credit to different moves—such as chemical combinations—based on performance.

When it comes to research and manufacturing of pharmaceutical products, AI helps researchers use genomic data to predict protein structures, improving diagnosis and developing new treatments. Using machine learning—one part of AI—to predict the three-dimensional structure of proteins from DNA sequences is another example. This is quickly becoming one of the biggest trends in the pharmaceutical industry in 2021.

By creating a highly-detailed computer model that replicates a human organ, pharma companies can see the effectiveness of different drug therapies on specific diseases.

When it comes to pharmaceutical manufacturing technology, which versions work? What are the side effects? What changes can we make to reduce the side effect’s severity? These are some of the questions AI can help answer quickly and efficiently without experimenting on humans or animals.

In terms of business, “artificial intelligence technology allows businesses to automate a variety of processes, frees up employees’ time and helps improve productivity.” The result is greater output in less time at lower cost, according to Intellspot.

AI also helps capture competitive research and analysis. One tool with that capability is Microsoft Power Bi. This software has three types of AI transformations:

  • Text analytics tags images and extracts key phrases
  • Vision analyzes images
  • Azure ML helps generate insights and predictions

ERPs and Regulatory Compliance

A major obstacle unique to technology in pharmaceutical manufacturing is dealing with FDA regulations. Many of these rules require strict recordkeeping. Modern ERPs, which share data between departments, allow companies to keep more accurate documentation and inventory. ERPs allow executives to review data for accuracy, ensuring that information from Inventory Control matches what Finance says it should report.

A key feature of sharing information between different departments such as Inventory Control and Finance, companies can spot areas for improvement. Are FDA documentation requirements being met? A simple query can give a CEO the answer for any department anywhere in the world.

ERPs can also ensure that product communications meet the FDA’s stringent requirements for truth under the Federal Food, Drug and Cosmetic Act (FD&C Act). These laws can result in severe fines for conveying important information the FDA considers misleading.

Labelling is another major part of FDA rules, one where D365’s Inventory Control Module for Dynamics Supply Chain Management stands out. This lets businesses generate barcodes and other labels, tracking products and batches from the moment they arrive through production to their delivery to customers.

Summary

Pharmaceutical manufacturing technology, like the use of AI or ML in research & development, are quickly becoming leading pharmaceutical industry trends since 2020, helping make pharmaceutical companies leaner and more efficient. Modern software like tier 1 ERPs lets them gather, sort and analyze information obtained from the continuous manufacturing of pharmaceuticals much more rapidly than ever before.

Keep up with the Pharmaceutical Manufacturing trends. Get an obligation trial of Microsoft ERP tailored for the Pharma Industry.

Schedule Demo

Three actions CEOs can take to get value from cloud computing

Three Actions CEOs Can Take To Get Value From Cloud Computing

Three Actions CEOs Can Take To Get Value From Cloud Computing 700 500 Xcelpros Team

Three Actions CEOs Can Take To Get Value From Cloud Computing

The last decade has seen accelerated growth and transformation in various industries as they embrace digital trends. There’s a pressing need for companies to streamline their processes and optimize their operations in an effort to go agile. Simply implementing cloud is not going to generate value for a business. Higher-level executives (especially the CEO) need to take lead in the journey towards digital transformation. For more information see the full article here.

Take your first step towards moving to the cloud with a consultation from XcelPros.

Get Started Now

Boosts Supply Chain Resiliency

Visible and Shareable Data Boosts Supply Chain Resiliency

Visible and Shareable Data Boosts Supply Chain Resiliency 700 500 Xcelpros Team

Introduction

Covid-19 and its variations, a trade war with China and ongoing cyber attacks are just some of the problems supply chain managers are still facing in 2021. Similar issues may occur at any time making supply chain managers nervous and cautious.

One way to improve overall supply chain performance is through accurate data collection plus improved vendor communications. Knowing what you need and when you will need it is important to keeping inventories under control.

Working closely with vendors is especially important when seeking diverse raw materials and active pharmaceutical ingredient (API) sources. Being able to pivot from a supplier in one country to a different firm halfway around the globe can make the difference between a happy customer and an unhappy one. Having more than one source helps make your supply chain resilient.

Critical components of a secure supply chain are:

  • Accurate, real-time data available to decision makers any time, anywhere
  • Detailed knowledge of each supplier and who supplies them
  • A diverse, geographically spread-out network of suppliers
  • Sharing appropriate data with vendors to ensure adequate inventories

Figure: 1Critical components of a secure supply chain are:

Critical components of a secure supply chain

All of this is based on data available through Internet of Things (IoT)-connected devices.

Data Collection in the Digital Age

The IoT lets companies connect real-time monitoring devices to a wide range of production machines. Each IoT device can then be connected to a Microsoft Azure IoT hub. The hub can signal when completing a manufacturing process or reaching an inventory threshold, for example.

Each data point goes into a secure, cloud-based network allowing authorized users to see the real-time progress of each production run. When appropriate, that data can be shared with vendors. Sharing select data with vendors lets companies maintain balanced inventories, informing them when supplies of a particular precursor chemical are running low, for example.

Performance data from many individual machines can be combined into one real-time data stream. When it is analyzed by as Microsoft Dynamics 365 Supply Chain Management inventory forecasting tools, pharmaceutical manufacturers can then reach out to their diverse vendor base, ensuring a constant flow of raw materials.

The same general process for raw materials coming into a plant applies to finished products leaving it.

D365’s Supply Chain Management module includes inventory tracking tools. Pharmaceutical manufacturers will know where every labeled and scanned product is at any point in time.

For example, say a company has part of a product manufactured in Asia and then sent to Europe for additional assembly. A Supply Chain Management dashboard containing data from a Microsoft Power BI report can let a company know of a major shipping delay, such as the Suez Canal blockage last year. Having all of this information in one spot at one time lets company leaders decide if they want to wait for the blockage to get fixed or ship the materials by air.

Having a diverse supply chain in terms of raw material providers and finished product shippers provides additional options and security.

Supplier Knowledge

The more a company knows about its suppliers, the better prepared the company is when disaster strikes.

In an article on supply chain mapping, Sedex states companies should:

  1. 1Learn where primary suppliers and their suppliers are located. Having detailed supplier records helps accomplish this task.
  2. 2Integrate this information into a single data source.
  3. 3Conduct a risk assessment to determine where to focus their attention next.
  4. 4Research each supplier so your company is aware of any risks to them.

Enterprise Resource Planning (ERP) tools such as Microsoft Dynamics 365 Supply Chain Management provide a single shareable data source. If, for example, a trade war breaks in one region, a company can sort through its supplier list and find out which companies are affected.

XcelPros has a unique approach to ensuring decision makers have information critical to them. XcelPros can create analytic reports using intelligence gathered in Microsoft Power BI. The reports can map geographic locations, such as those of raw material providers. The Power Bi report is then embedded in a D365 Supply Chain Management dashboard, giving executives “at a glance” views.

Combining the artificial intelligence capabilities of Supply Chain Management with the analysis functions of Power BI lets executives know what is happening in terms of potential supply chain disruptions and where they might occur.

Power BI features include:

  • Transforming data in shareable graphics
  • Explore data obtained from many sources
  • Share customized dashboards and data, such as between Sales and Inventory Control

Having geographically-dispersed vendors also helps.

Supply Chain Diversity

What happens when your primary API supplier’s workforce is decimated by another round of coronavirus infections? For example, say Supplier A does not have enough healthy workers to produce the quantity of essential materials at the right quality point. If your company has other vendors who can fulfill your order requirements, nothing changes with your customer. If you don’t have back-up suppliers or ways to get the finished products to them, it could cost you.

A study by the Hackett Group found that those with a diverse supply chain had lower overall operating costs and spent 20% less on buying.

Effects include a higher return on investment (ROI), lower prices to the manufacturer’s customer and improved customer service, an article in Supply Chain states.

Working with small and medium-sized business suppliers (SMBs) has several advantages over only dealing with large multi-nationals. These include:

  • Efficiency at the local level
  • Innovative services
  • Faster delivery when the SMB is closer to the plant

Figure: 2Advantages of working with SMB Suppliers

advantages of small and medium-sized business suppliers (SMBs)

“The companies that build resiliency into their supply chains will be best positioned for success and growth as they will have an adaptive advantage in the face of change and volatility,” Supply Chain states. Having options in terms of near-shore and off-shore suppliers lets, “companies spread their risk, mitigating the impact that social, political and geographic incidents could have on raw material price and availability.”

Supply chains that are diverse in terms of location and their ability to provide raw materials and precursor chemicals give pharmaceutical manufacturers the ability to survive disruptions.

Having this information is one thing. Letting the people who have what you need in time to get it to you is also vital.

Supplier Communications

“Effective communication between buyers suppliers helps support long-term goals by building a strong and trusting relationship in which both parties are comfortable sharing information and working together to support these goals,” a report by the ISS Group states.

“Communication builds trust and ineffective communication demolishes it,” a Canadian Center for Science and Education report cited by ISS states.

Giving suppliers advance knowledge of the types and quantities of needed materials can prevent potential problems, such as running out of stock. Companies can improve risk management when vendor communications share real-time data over a secure, cloud-based network. Microsoft D365 provides the data sharing and security functions required by today’s top pharmaceutical manufacturers.

Dynamics 365’s Finance module provides data sharing between a company and up to 15 legal entities. For example, a pharmaceutical manufacturer wants to share some inventory information with a partner to ensure the production plant has enough raw materials on hand for a special project. D365 Finance permits sharing the reference and group data but not transactional information like the name of the customer requesting the project.

Sharing the information between a manufacturer and its vendors is based on an important assumption: there is accurate, timely data.

Supplier communications also lets companies monitor product quality. Quality assurance is critical, especially in terms of medicines, drugs and other pharmaceutical products requiring regulatory compliance.

Summary

Supply chains can be very fragile as the debacles from 2020 have proven. Having accurate inventory information, knowing how each supplier is affected by activities and events beyond their control and communicating with them will help make your supply chain more resilient.

Book a assessment to get started with our data management solutions built for supply chain resiliency.

Book Now

ERP and Big Data

ERPs Make Big Data and Big Business a Good Match

ERPs Make Big Data and Big Business a Good Match 700 500 Xcelpros Team

Introduction

What does “Big Data” mean to you and your company? To many, the phrase means large quantities of information from different sources, data that changes by the second. For example, it can refer to the temperature of a chemical process where a small variation makes the difference between good product and wasted materials.

A common big data definition is, “a collection of data that is huge in volume yet growing exponentially with time,” guru99.com states. The “4 Vs of Big Data” are:

Figure: 14 Vs of Big Data

4 V's of BigData

  • Volume, in terms of data coming from multiple sources at the same time
  • Variety, which can be flow volumes, temperatures, production costs and other information calculated separately
  • Velocity, referring to the speed of information from application logs and device sensors (IoT)
  • Variability, data flows when a machine is running and stops when the production cycle ends

“Big Data” can also refer to lines from sales contracts referencing products, volumes and/or quantities from several customers. From a supply chain perspective, those same sales numbers require raw materials plus labor and machine operating time to produce them.

In the past, “Big Data” often referred to information from one department such as Production or Sales. One of the biggest challenges with big data is providing information siloed in one department to other areas that need it.

There are even challenges to searching big data, which includes getting results based on the query. When the query isn’t phrased correctly, or a required document has a naming error, important information is left out.

A key challenge is overwhelming volume.

  • The New York Stock Exchange generates one terabyte of data each day
  • Facebook cranks out more than 500 terabytes of customer-uploaded photos and videos every day
  • A jet engine generates more than 10 terabytes of data in 30 minutes of flight

By the Numbers

Many businesses are drowning in data, not all of which is useful.

  • 8%: the number of businesses using more than 25% of internet of things (IoT) data available to them
  • 10% – 25%: Marketing databases containing critical errors
  • 20% – 30%: Operational expenses directly tied to poor data
  • 40%: The growth rate of corporate data with a study by SiriusDecisions finding organizational data typically doubles every 12-18 months
  • 40%: the number of businesses missing business objectives because of poor data quality
  • $13.3 million: The average annual cost of poor data quality

Big Data Costs

Big Data comes with costs, especially for in-house networks. Once data is obtained, it gets stored before being analyzed. Data is usually backed-up in case something happens to damage, destroy or in the case of hacking, hijack it.

The actual costs of this data varies based on business size and need. Estimates place the lowest range at $100 – $200 per month to rent a small business server. Installation costs typically start at $3,000 and go up from there.

Big Data includes up-front as well as hidden costs. Up-front costs most people see consider includes:

  • Software tools to manage and analyze data
  • Servers and storage drives to hold the data
  • Staff time to ensure the physical devices work properly and to manage the data

These costs scale proportionally depending on the business’ storage and retrieval requirements and the processing power required to gather the data.

Hidden costs usually refer to the bandwidth needed to move data from one source or site to another. While we might consider it a simple task to download a movie on a cellphone, moving terabytes of data between servers can be significantly more expensive.

Accurately estimating big data costs is basically impossible without a detailed look at each company’s specific requirements and needs. However, online research estimates them to be anywhere from several hundred dollars per month for a small business to tens of thousands of dollars per month or more. Infrastructure costs alone can easily top $1,000 – $2,000 per terabyte (TB) with qualified outsourced consultant pricing averaging between $81 – $100 per hour.

Big Data Limitations

Having access to large volumes of data is great – when a company knows what to do with it. Especially when servers are in-house, big data has its limitations. These problems include:

  • Software tool compatibility, such as different types and brands of databases
  • Correlation errors, such as linking incompatible or unrelatable variables
  • Security and privacy from the standpoint of only exposing your data to the eyes of qualified people

From a mechanical perspective, one industrial device might use a Siemens programmable logic controller (PLC). Another device can use a Rockwell PLC and a third could be from Mitsubishi Electric. These different devices add additional layers of complexity.

Using supervisory control and data acquisition (SCADA) architecture is one way some larger companies are resolving PLC compatibility issues. SCADA includes computers, networked data communications and graphical user interfaces.

Figure: 2Big Data Limitations

Big Data Limitations

Resolving Big Data Issues

One way pharmaceutical companies can resolve rising big data issues, especially those caused by using older, legacy systems is with a modern ERP. Enterprise resource planning software such as Microsoft Dynamics 365 (D365) resolves many of these incompatibility issues.

Data integration is a major big data problem for companies that use one database in production and another in finance.

D365’s data integrator is a point-to-point integration service used to integrate data. It supports integrating data between Finance and Operations apps and Microsoft Dataverse. The software lets administrators securely create data flows from sources to destinations. Data can also be transformed before being imported.

Dual-write—a related D365 function—provides bi-direction data flow between documents, masters and reference data.

This type of data collection raises potential ethical issues when accessing large quantities of personal information, which could include contact information for patients enrolled in a new drug study.

Installations by professionals experienced in working with pharmaceutical companies can organize data and help strip out personal information. Removing it reduces the chance of a HIPAA (health insurance portability and accountability act) violation.

Being a cloud-based product, D365 also cuts down many of the personnel costs associated with big data management and maintenance. Microsoft assumes those costs along with the burden of data security.

Conclusion

Having a lot of information lets companies make accurate, informed decisions. Problems crop up when data is kept in departmental silos. Using an ERP to integrate information across departments removes many barriers to sharing information, which leads to more accurate sales and inventory predictions, reducing overall costs and boosting profits.

Boost Your business ROI with Microsoft Dynamics 365 and manage big data efficiently. Book a consultation to learn more.

Book Now