Power BI

Advanced Analytics and Power BI in Chemical Manufacturing

Advanced Analytics with Power BI in Chemical Manufacturing Industry

Advanced Analytics with Power BI in Chemical Manufacturing Industry 700 500 Xcelpros Team

Chemical manufacturing is a complex process with several different variables to consider at any given moment. Staying ahead of the competition today means using technology to help drive productivity and profitability.

Advanced analytics features in Power BI supply valuable insights into the substantial amounts of data that enable chemical manufacturers to make more informed decisions and optimize their operations.

In this blog post, we’ll explore how advanced analytics in Power BI can help chemical manufacturers drive productivity and profitability, including how data-driven decisions can be used to improve performance, reduce costs, and create more value for the business.

Power BI and the benefits of Advanced Analytics

In the chemical industry, data-driven decisions are necessary for businesses looking to maintain a certain level of efficiency and profitability. This means that organizations need access to reliable analytics and insights from their data to make strategic decisions that lead to better outcomes. Advanced analytics in Power BI are powerful tools that can help chemical companies maximize their productivity and profitability.

Advanced analytics solutions offer various features designed to help chemical companies find trends, uncover hidden patterns, and predict future events. Using the latest AI-based algorithms, these advanced analytics solutions can uncover insights that would otherwise be impossible to discover, resulting in improved decision-making and more efficient operations.

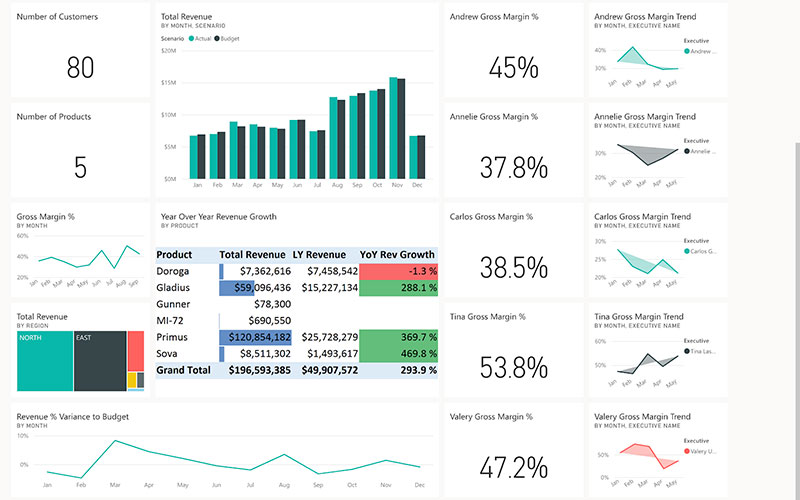
Power BI is an analytics tool that provides an interactive platform for visualizing and slicing data. Included features like charts, graphs, and dashboards allow users to easily explore and analyze data from anywhere, making it easy to gain a comprehensive understanding of their data and make more informed decisions.

Figure 1:Benefits of Advanced Analytics in Power BI
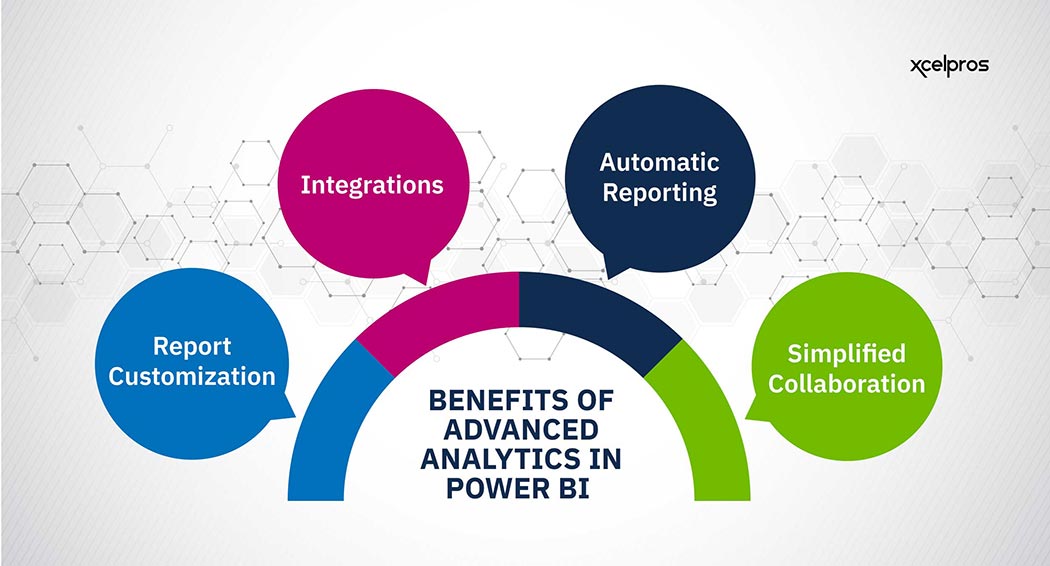
Benefits of Advanced Analytics in Power BI

Integrations

Power BI is a powerful business intelligence tool that can integrate with various systems, including enterprise resource planning (ERP), customer relationship management (CRM), financials, and more. These integrations make connecting data across different platforms easier, ensuring that all stakeholders have access to the information they need to make decisions quickly and accurately.

For businesses in the chemical industry, Power BI integrations can be incredibly useful for businesses in the chemical industry. They allow companies to make better use of their data and get insights from multiple sources. An ERP integration can help track inventory and orders, while a CRM integration can offer information about customer preferences and buying habits. By connecting these different systems, businesses can better understand their market and customers.

In addition, Power BI integrations can be used to improve operational efficiency. By integrating various systems, such as enterprise asset management (EAM) and predictive maintenance systems, businesses can get real-time insights into their equipment’s performance. This can help them find potential problems before they become major issues and ensure that their operations run smoothly.

Overall, Power BI integrations can be invaluable for businesses in the chemical industry. By connecting multiple systems, they can gain better insights into their operations and customers, improve operational efficiency, and ensure compliance with regulatory requirements. With Power BI, businesses can make better use of their data.

Automatic Reporting

Power BI supports automated reporting to help show trends and improve productivity. This automation allows companies to quickly find problems or opportunities within their processes and operations, which helps them make informed decisions quickly and efficiently.

With automated reporting capabilities, businesses in the chemical industry can save time by automating data collection and reporting processes. They can also receive help from the insights generated by this process, allowing them to make smarter decisions in less time. With accurate and up-to-date data, businesses can measure performance, compare trends, and optimize operations more effectively.

Overall, automatic reporting with Power BI helps businesses in the chemical industry achieve greater efficiency, profitability, and customer satisfaction.

Report Customization

Power BI gives businesses several ways to customize reports to meet the needs of any business, including those in the chemical industry. Businesses can quickly and easily customize their reports to streamline the entire process. This includes creating personalized visualizations, adjusting the format and layout of data, and adding new elements to existing reports.

Customized reports can give these businesses key data points to check progress, performance, and safety. Reports can be tailored to track specific aspects of a business’s operations and production, allowing for more efficient and effective decision-making. The customization process is highly intuitive and provides users with an interactive dashboard for creating and editing reports.

Overall, report customization provides businesses in the chemical industry with the tools they need to stay ahead of their competitors and maximize their value in the market. With custom reports, companies can easily identify trends and make better decisions faster, increasing productivity and profitability.

Simplified Collaboration

Power BI was designed from the start to promote collaboration and communication across teams in the chemical manufacturing industry, simplifying data sharing and streamlining how different departments and locations work together to achieve their objectives.

One of the main benefits of Power BI is that it helps users break down data silos. By allowing users to pull from multiple sources, such as cloud-based databases and on-premises sources, Power BI enables users to get a comprehensive view of their data. This helps decision-makers in the chemical manufacturing industry better understand the relationships between different pieces of data, which can then inform more informed decisions.

Power BI also makes it easier to access and share data with others within the organization. Through built-in visualizations, users can easily create a dashboard of all the data they need to review, making it easier to collaborate on data-driven decisions. Power BI also offers custom security settings, allowing users to control who can view, edit, and access the data. This ensures that sensitive data stays secure and private while allowing users to collaborate on projects.

Power BI’s collaborative features make it an invaluable tool for the chemical manufacturing industry. By eliminating data silos, users can access a single source of truth that can be shared with anyone in the organization. Additionally, its ability to restrict access to certain data and its customizable security settings help keep confidential information safe. Finally, its built-in visualizations help make it easier for everyone involved in a project to collaborate on data-driven decisions.

Predictive Maintenance, Throughput Analytics, and Maximizing Value

Chemical manufacturing is an incredibly complex industry with many operations and processes. Fortunately, advanced analytics and Power BI can help chemical producers make data-driven decisions and optimize their production, maintenance, and supply chain operations. Three advanced key analytics–based tools can help chemical producers improve their performance: predictive maintenance, throughput analytics, and maximizing Value.

Predictive maintenance is one of the most effective ways to ensure the best performance of chemical manufacturing assets. This tool uses machine learning algorithms to identify patterns in equipment behavior and predict potential failures before they occur. Predictive maintenance also helps to minimize downtime by enabling initiative-taking maintenance actions. This approach can increase operational efficiency and reduce costs associated with unexpected equipment breakdowns.

Throughput analytics are essential for optimizing production operations in chemical manufacturing. By analyzing production data, chemical producers can gain insights into their processes’ efficiency, find improvement opportunities, and reduce waste and inefficiency. Yield analytics can decide how effectively raw materials are being converted into finished products, while energy analytics helps producers identify areas of excessive energy consumption. Finally, throughput analytics enables chemical producers to optimize their production schedules by tracking the performance of each stage of the process.

Maximizing Value is important for enhancing the profitability of chemical producers’ supply chains. Power BI uses advanced tools to analyze customer data and uncover valuable insights that can be used to create new products and services that meet customer needs. Value maximization can also help chemical producers find opportunities to reduce costs in their supply chains by streamlining processes, finding more cost-effective sources of raw materials, and improving planning operations.

Next Steps

As with any technology solution, getting the most out of Power BI for your chemical manufacturing business requires a solid implementation plan. To ensure success, best practices for implementing Power BI at a chemical company should include these steps:

  • Gathering requirements from key stakeholders to find specific data needs and business goals.
  • Designing an analytics solution tailored to the organization’s unique business and data environment.
  • Developing an end-user interface that is intuitive and easy to use.
  • Training users on how to get the most out of their Power BI data.
  • Testing and refining the system to ensure it meets the needs of all stakeholders.

If you are ready to take the next step in using advanced analytics and Power BI to improve productivity and profitability in your chemical manufacturing business, contact us to learn more.

Schedule a call, our experienced team can help you design, implement, and support a custom solution tailored to your requirements. With the right analytics solutions, you can drive performance while getting the insights you need to stay competitive in today’s changing markets.

Get the Most Out of Your Business with Microsoft Power BI

Get the Most Out of Your Business with Microsoft Power BI

Get the Most Out of Your Business with Microsoft Power BI 700 500 Xcelpros Team

Introduction

In highly regulated industries like Chemical, Pharmaceutical, and Life Sciences – being able to analyze your data quickly has become critical for everything from ensuring a good customer experience to understanding changes in the market.

Microsoft Power BI connects your data to all the tools you use daily, from Excel and Outlook to Microsoft Dynamics 365 and dozens of applications in between, aiding collaboration and the generation of actionable insights. Compared to older manual processes, Power BI doesn’t just save you time—it helps you get the most out of your business, so you can focus on moving your company forward. Learn how Power BI Connectors can help you today by giving your business access to the data it needs to grow faster and reach new heights.

The future of analytics

Data and analytics have become increasingly important for a wide range of businesses, especially in recent years where adoption is growing.

Figure 1:Worldwide BI & Analytics Growth

Worldwide BI & Analytics Growth

Source: Apps Run the World; Statista 2022

While regulations have traditionally been enforced by a group of people inside a company, these regulators expect to see evidence-based decision-making from businesses at all levels. Maintaining visibility into data from various sources is essential to comply with certain regulations. Because of the number of data sources and systems that companies can use today – often including disparate technologies or providers – it can be not easy to extract data across platforms for analysis purposes.

In the Chemical, Pharmaceutical, and Life Sciences industries, where regulatory oversight has always been a top priority, the need for reliable analytical tools has significantly increased over time.

Immediately, you may not know what would make a difference in terms of driving customer behavior or improving customer experience without proper analytical tools, without data showing trends like customer purchases about prices and features offered by competitors, or where customers spend most of their time within your site, or which pages result in the highest bounce rates?

Data collected from marketing campaigns are used to help answer questions about customer engagement, usage habits, and preferences to improve engagement throughout the user journey. Understanding the general pattern of what makes your customers tick is necessary to gain insight into their behaviors and needs – even if they don’t give you direct feedback! Regular monitoring through powerful analytic solutions like Power BI makes this type of feedback easier than ever.

Where does Power BI fit in?

Power BI is a Microsoft cloud-based business intelligence and analytics platform that helps businesses run on multiple systems to get the most out of their data. Power BI has a growing library of connectors that helps businesses connect different sources to analyze data and create unique reports and role-based dashboards. Power BI can track key performance indicators (KPIs), monitor sales and marketing campaigns, and understand customer behavior.

Power BI can help businesses in the Pharmaceutical, Chemical, and Life sciences industries use their data more efficiently to make better decisions. For example, a company that manufactures chemicals for use in other products could run simulations based on different product characteristics and use Power BI to analyze the output from these simulations. If one type of product were found to be more profitable than another under certain conditions, they would know which products to produce more or discontinue producing altogether.

Additionally, a company that produces vaccines needs to know exactly how much demand there will be for their vaccine before it’s released into production; with Power BI, they can plot a forecast for where demand might be higher or lower than expected, letting them adjust their production accordingly. As Microsoft grows its library of Power BI connectors, companies will have easier access to all sorts of valuable data and insights.

What Are Power BI Connectors?

Power BI connectors are a part of the software that allows you to connect different data streams in one location – perfect for any business that runs on multiple systems. For example, suppose you’re a chemical manufacturer offering consulting or testing services. Power BI connectors could link the two systems together to generate automatic reports and analyses.

This lets you import data from one system into another system or export data into another. This makes it possible to see all your information at once without going back and forth between systems. Power BI connectors link data sources based on predefined rules and patterns. They also come pre-built with smart visualizations and customizable dashboards, allowing you to view all your information at once without switching between each company’s app or website.

Once you implement Power BI, you can use available connectors for free! The library of power bi-connector options continues to grow as more businesses find the value in using them for their purposes. These days, you can use Power BI connectors to do anything from importing bank statements into payroll management software to analyzing customer sentiment over time. There are many benefits to using power bi connectors.

One major benefit is the ability to analyze your company’s data in-depth without ever having to step outside of Microsoft Office 365. This makes it easier for employees who don’t normally share responsibilities related to finance or sales reporting, for example, because they know they can stay within their comfort zone while still getting the job done efficiently.

In addition, those employees will always know what needs to be done because they’ll always have access to relevant information and charts and graphs that provide additional context around certain trends.

What about security, privacy, and compliance

Regarding business data, security, and privacy are always top concerns. Microsoft is aware of this and has taken steps to ensure that the data it collects with Power BI is secure and in full compliance. For starters, all data is encrypted both in transit and at rest.

Power BI complies with major industry standards like HIPAA, SOC 2, and GDPR. It’s easy to see why so many companies trust their data to Power BI for their analytics needs. Data is processed on an isolated instance, ensuring there’s no possibility of a breach from a compromised network server.

To stay on top of any potential breaches that could arise from malware infections or unauthorized access attempts, administrators can monitor the system for any suspicious activity. They can also set up alerts and audit logs to track who accessed what data, when and where they did it from. If something happens, the company will have information about how it happened and what was lost, as well as how they could mitigate the damage.

Power BI works hard to keep your data safe by having dedicated security features designed specifically for businesses including:

  • A dedicated infrastructure architecture separates workloads into individual virtual machines and prevents cross-contamination.
  • Several built-in protections against SQL injection attacks.
  • Protection against cross-site scripting (XSS) via double validation tokens.

These protections help make sure you’re safe while you work on your dashboards!

Next Steps

While it’s true Microsoft’s Power BI is a powerful tool that can help businesses gain insights into their data, even across different systems, to get the most out of it you need an experienced partner who can implement Power BI seamlessly and connect it to your other systems. Working with a partner that understands your industry means less time is spent trying to figure it out on your own.

An experienced partner will help you maximize the value of Power BI and ensure that you are getting the most out of your investment. With an experienced partner, you’ll also have a strategic advisor who can advise on addressing your needs through customizations and integrations. Plus, they’ll help you keep your system up to date so that you’re always maximizing the value of your investment in power bi.

Maintaining an enterprise-wide analytics platform requires expertise from partners who understand not only what software does but how to use it as well. For instance, if a company has never used SQL before or has no knowledge about R scripting, you’ll want to investigate more experienced support.

Xcelpros offers hands-on industry experience implementing Microsoft Power BI analytics with custom extensions and connectors that provide customers with deep insight into their data and seamless integration between disparate business systems.

Schedule a call today to see how we can help you meet your business goals.

The Changing Landscape of BI tools and Microsoft D365 F&O in Manufacturing

The Changing Landscape of BI tools and Microsoft D365 F&O in Manufacturing

The Changing Landscape of BI tools and Microsoft D365 F&O in Manufacturing 700 500 Xcelpros Team

Introduction

We’ve seen quite a few changes in manufacturing over the past two decades, with the next two promising to bring even more exciting things to come. As manufacturing continues to evolve, there are several trends that manufacturers need to be aware of that can either help or hinder the success of their business in the future. Business Intelligence software and tools will play an important role in the future of manufacturing. Microsoft Dynamics 365 F&O plays an important role in how this type of business intelligence information can be analyzed and used to guide business decisions for years to come.

Change in Operations

In today’s business climate, the ability to make data-driven decisions is more important than ever before. This means having access to the right business intelligence (BI) tools for manufacturers. With the right BI tools, manufacturers can gain insights into their operations that would otherwise be hidden. For example, they might discover an increasing trend of machine failures due to a manufacturing defect or determine which materials are most profitable at which price points. With so many BI options available on the market, it can be difficult for companies to figure out which ones will provide them with the best ROI.

Fortunately, Microsoft Dynamics 365 F&O provides a comprehensive solution for any size company looking for a comprehensive BI toolset. Specifically, Microsoft Dynamics 365 has four modules designed to meet the needs of manufacturers across all industries: Operations (also known as Production), Sales, Financials/Accounting, and Customer Service. These modules provide everything from real-time data visualization tools to automated dashboards – all designed with specific manufacturing needs in mind.

A Change in Dynamics

As the world of business intelligence (BI) changes, so does Dynamics 365. This is especially apparent in the manufacturing industry. Microsoft Dynamics F&O provides users with access to data that can help them understand what is happening in their business and take corrective action when necessary.

The software has become an increasingly important tool for manufacturers as they seek to understand their operations and make decisions to improve their bottom line. But, as new technological developments bring a shift from relational databases to machine learning algorithms, it becomes essential for these companies to find a BI platform that can evolve with them. With Dynamics 365’s cloud-based solution being constantly updated; it offers just that functionality needed by these businesses.

How people use BI tools also shifts over time, and with Dynamics 365’s modular design, there are no limitations on how you interact with your data. For example, you can use graphs or tables to show certain information at different times depending on the needs of your business. Suppose a user wants more advanced analytics like neural networks or deep learning capabilities. They are available through add-ons such as Azure Machine Learning Studio or R Server Developer Edition. There is no need to switch systems when you need more advanced analytics; all the options are right within Dynamics.

Business Analytics Tools

Today, data is more important than ever before. This is why more manufacturers are turning to Business Intelligence (BI) tools to help them make sense of the information they’re collecting. BI tools can help you track key performance indicators (KPIs), understand trends, and make better decisions for your business. And this will only become more important as regulations change, competition intensifies, and customer needs evolve.

As things continue to change, it’ll be essential for manufacturers to remain agile enough to adapt quickly – and that means looking at what Business Intelligence tools they’re using now and how their needs might shift over the next few years. For example, there’s been a significant shift from big Data Analytics over recent years as IoT (Internet of Things) solutions become more ubiquitous. As a result, analytics solutions designed for analyzing small datasets have fallen out of favor with larger manufacturing companies.

Industry Challenges

Tools aren’t the only important factor, either. The manufacturing industry is under constant pressure to improve productivity while reducing costs. To stay competitive, manufacturers must adopt new technologies where they can. With so many options on the market, it cannot be easy to know which BI tool is right for your business. Luckily, this question has been answered by a study from International Data Corporation (IDC). IDC’s 2018 Worldwide Semiannual Manufacturing Smart Machines Spending Guide revealed that artificial intelligence-powered analytics would become increasingly important over the next five years.

Figure 1:The Growth of Artificial Intelligence-Powered Analytics

The Growth of Artificial Intelligence-Powered Analytics

According to a report from marketsandmarketsblog.com, The global AI-powered analytics market is projected to grow from $10.5 billion in 2021 to $28.1 billion by 2026 – at a CAGR of up to 21.7% over the forecasted period.

What does this mean for manufacturing? Manufacturers need data about their performance – not just about their products or services but also about their employees and processes. Using intelligent systems like augmented reality or virtual reality combined with artificial intelligence-powered analytics will allow manufacturers to better predict outcomes and make data-driven decisions that drive profitability while improving employee engagement levels.

One organization already doing this is Caterpillar Inc., who implemented digital transformation into its retail stores through an AR application called CatAdvisor. CatAdvisor uses computer vision and 3D point clouds to help retailers sell more products, identify inventory gaps, analyze customer preferences and monitor store traffic patterns. And now Caterpillar is piloting sensors in stores using machine learning and IoT technology to get even more granular insights into customers’ preferences. With these AI-powered solutions available today, there really isn’t any excuse for a manufacturer not to embrace advanced analytics!

The Changing Role of Operations Management

Even operations management in the manufacturing industry is going through significant changes. In the past, the focus was on production efficiency and cost reduction. Today, the focus is on customer needs and market demand. To meet these new challenges, manufacturers are turning to business intelligence (BI) tools and Microsoft Dynamics 365 F&O. Together; these modern solutions enable better insight into product quality, reliability, compliance, and any other KPIs that impact the end customer experience.

Manufacturing companies can also use BI tools to gain insights into their operations with real-time data analysis that can be used for decision-making, such as material sourcing or capacity planning. These solutions allow manufacturers to increase throughput and reduce downtime. For example, a manufacturer may have a bottleneck at one part of the process because they can’t produce enough parts quickly due to the limited availability of materials. With BI, they could track down the problem by looking at lead times, inventory levels, and component dependencies. With this information, they could find alternative suppliers or renegotiate with existing suppliers to free up those materials so they can increase production volume.

The bottom line is this: Manufacturers need to know more about their supply chain than ever before – which means being able to access real-time data at any time in any location.

Power BI Connectors

Business intelligence tools are nothing new. They’ve been around for decades. But what is new is how manufacturers use them to gain a competitive edge. With the rise of Industry 4.0, manufacturers are turning to business intelligence tools to help them make sense of the vast amounts of data generated by their factories. And with the help of included Power BI connectors, integrating these tools into different systems has become incredibly easy.

Power BI Connectors are an innovative way to enhance manufacturing business intelligence data with minimal coding. Rather than manually inputting data into your business intelligence software, connectors automatically export data from other sources directly into Power BI without extensive development. This saves time and money by minimizing any manual processes and gets you up and running faster than ever before. You can choose from various pre-built connectors for industry-leading applications like Microsoft Dynamics, SAP, Salesforce, Google Analytics, Twitter, and many more. You can even build your own if needed.

These pre-built connectors make it easy to create dashboards and reports that analyze and display information from multiple data sources simultaneously. With the advancement of these connections, more and more enterprises have access to enterprise-grade business intelligence capabilities for whatever ERP solution they use.

Schedule a call today for more information to get the ball rolling in your favor.

Putting it All Together

At least for the rest of the decade, the manufacturing industry will undergo some big changes. One of the most significant will be the increased adoption of modern business intelligence solutions, giving manufacturers a view of their operations that was previously unavailable. We should also see Microsoft Dynamics F&O become a more integral part of manufacturing operations. This cloud-based solution will allow manufacturers to manage their business processes more efficiently and effectively.

As manufacturing evolves towards smart factories and advanced automation, keeping up with the latest trends will require a constant commitment to learning new skill sets. This includes expertise in coding and digital engineering design and mastery of traditional engineering disciplines like materials science and mechanical engineering. For the best support, companies should look for partnerships with consulting firms that specialize in training employees across all levels of skill sets needed for today’s manufacturing environment.

Conclusion

As the manufacturing landscape changes, so do the business intelligence (BI) tools that help manufacturers make data-driven decisions. To stay competitive for the rest of the decade, manufacturers should consider ramping up the adoption of modern BI tools that can take advantage of the available wealth of data. Microsoft Dynamics is one of the best tools available to help manufacturers streamline their operations and better use their data.

Partnering with an experienced provider who understands the manufacturing industry and can help you get the most out of your investment with full visibility is important. By working with the right company, manufacturers can better understand their customers’ needs and drive efficiency across all departments. A complete Business Intelligence solution should allow manufacturers to collect, store, analyze, and share information on every aspect of their business.

Pharmaceutical analytics and business intelligence using power bi banner

Pharmaceutical Analytics and Business Intelligence using Power BI

Pharmaceutical Analytics and Business Intelligence using Power BI 700 500 Xcelpros Team

Introduction

Modern pharmaceutical companies are undergoing a significant transformation with new opportunities from digitization, big data, and analytics. In response to COVID-19, businesses are seeing an increased need for an agile enterprise Business Intelligence (BI) architecture to leverage these opportunities in order to grow. Successful Pharmaceutical companies are looking beyond standard operational and statutory reports to implement more powerful Analytics and AI-driven solutions. These new solutions provide actionable insights and useful KPIs to help make better decisions. This leads to more empowered teams and new engagement that drives additional revenue.

Pharmaceutical companies generate massive information every day through their day to day operations. But the data is not always being put to the right use. Some companies tend to look at reports with a traditional eye that doesn’t drive a ‘call to action’ to grow the business.

The strength of any analytics software lies in its ability to help users easily create quick insights, especially for an agile business like pharmaceutical manufacturing. Creating reports in days instead of months frees up hundreds of hours in unnecessary spend to gather these hidden insights. This allows business leaders to repurpose cost savings towards other operational improvements and growth.

There is a right and wrong way of reporting – one provides overwhelming numbers, while the other means to understand those numbers and make them actionable.

As the pharmaceutical industry continues to undergo significant adjustments to new opportunities presented by digitization, big data, and analytics, more enterprises continue to see the need for an agile enterprise Business Intelligence (BI) architecture to leverage these opportunities & seamlessly deliver business-critical insights to executives.

The Strength of PowerBI

Power BI, Microsoft’s business analytics solution, lets you visualize your data and make it accessible to your Organization. Insights can be easily shared through various platforms of your Organization by embedding them in your app, portals, or website, collaborating on Teams, and integrating them into your ERP or CRM applications. Microsoft’s Power BI makes it easy to combine these numbers from different sources, streamline analytics onto a single dashboard, act on newfound insights, and enhance visibility to other teams in your organization.

Leveraging PowerBI interactive reports in a few quick and easy steps

  • Onboard
    • Access PowerBI either from powerbi.com or any of the Microsoft ERP/ CRM applications.
    • Connect to your data wherever it lives.
    • Explore your data with interactive visuals.
  • Collaborate & Share
    • Publish reports and dashboards.
    • Collaborate with your team.
    • Share insights inside and outside of your Organization.
  • Access insights from anywhere
    • Act with seamless access to data insights from your desk or home.
    • Access on the go with Power BI visual reports built rapidly.

Book a demo to learn how Power BI can boost your pharmaceutical analytics.

Book Now

Turning Industry Data into Smart Decisions

Leading Pharmaceutical companies who are transforming into agile organizations need 360-degree insights for business-critical functions such as manufacturing execution, sales productivity, financial management, purchasing raw materials from approved suppliers, quality assurance & quality control.

Today’s pharmaceutical organizations collaborate, monitor, and communicate on available live data to achieve operational excellence. Pharmaceutical business intelligence enables these organizations to monitor real-time data from multiple sources and combine them into one pharmaceutical dashboard with the ability to drill-down into the report to identify issues, as necessary.

Figure 1: Pharmaceutical Analysis using Power BI

Pharmaceutical Analysis using Power BI

Usage in the Pharmaceutical Industry

01.Interactive Reports

Power BI is an analytics software that brings to the table a strong background in delivering end-to-end BI analytics to modern Pharmaceutical companies such as

  • Efficiency Reports On Lot Production
  • Trending And Analysis Of Quality Control Data
  • Recommendations Based Clinical Trial Reporting
  • And Financials Per Batch Produced For Each Product
  • Product Go to market assessments (how much spend and types of activity is involved, expected and actual results)

02. KPI Reporting

Accurate decision making occurs when reporting provides clarity on both good and bad data points on prime KPIs. With business analytics in the pharmaceutical industry, companies can acquire intelligence in real time and can track key performance indicators like:

  • Machine utilization
  • Process efficiency
  • Cost of Sales
  • Inventory levels
  • Batch Losses and cycle times
  • Quality standards of a product line
  • Customer engagement and customer experience

03.Real-Time Analytics

One of the essential requirements for agile Pharmaceutical companies is to have real-time analytics of overall operations, and to be able to make quick corrections and proactively handle situations before they turn into risks. Especially for manufacturing execution and pharmaceutical inventory management, knowing the work is progressing and inventory is turning around helps production supervisors to manage batch production processes much faster and make on the fly corrections. This real-time reporting on screens throughout a production plant gives needed visibility to both the managers and operators who can be alerted and fully aware of any issues.

Figure 2:Real-Time Data Tracking with Power BI

Real-Time Data Tracking with Power BI

Benefits of PowerBI enabling business improvements

  1. 1. This information gives the ability to make changes to processes based on how well resources are functioning to increase productivity, and how each product lot produced is performing in the market.
  2. 2. Getting real-time alerts with Power BI mobile apps makes your operations more efficient, allowing you to achieve a higher level of organizational agility and minimize response times.
  3. 3. Power BI enables monitoring of your supply chain end-to-end, letting you identify problems and potential bottlenecks before they can affect critical processes.
  4. 4. Monitoring quality inputs and outputs from all sources, including your customers, allows you to make quick and meaningful decisions that will improve the quality of batches that are manufactured.
  5. 5. The ability to share your dashboards with suppliers and partners is a plus and accommodates adjustments to the latest information available to work towards making your processes leaner and smarter.
  6. 6. Microsoft’s Power BI is a full-featured BI solution that offers a number of benefits to many different organizations on their path to success such as –
    • Global Scale – Local Speed
    • Agile Business Processes
    • Predictive Analytics
    • Machine-to-Machine
    • Employee Onboarding

Basic analytics used by the Pharmaceutical Industry

  • Products & Inventory
    • Full Track & Trace Functionality
    • Enhanced Global Marketability
    • Customer Requirements
    • Product Quality
    • Product Recalls
  • Sales
    • Quotes & Order analysis
    • Pricing and Cost reporting
    • Available-to-Promise reporting
    • Order Profitability
  • Supply Chain Management
    • Match demand and supply
    • Improved Supply Chain Responsiveness
    • Updated and efficient Logistic analysis
  • Financial
    • Product Profitability reports
    • Batch costs
    • A full audit of transactions
  • Manufacturing
    • Safety and sustainability analysis
    • Realtime production data reports
    • Equipment failure predictions
    • Production rescheduling

Final Thoughts

A big step towards change today comes from enhancing visibility across all operations including manufacturing execution, sales force productivity, procurement, and financials. Power BI brings to the table a strong background in end-to-end BI services for modern pharmaceutical companies – covering BI strategy, managed services, implementation & support, and even more. From the moment you start considering a BI solution for your growing Pharmaceutical company, the benefits of Microsoft’s Power BI become evident very quickly. Microsoft’s Power BI will continue to be a must-have product for leading Pharmaceutical companies by delivering a 360-degree insight of operations.

References: Advantages of Using Power Bi

Effectively-Tracking-and-Controlling-Inventory

Effectively Tracking and Controlling Inventory

Effectively Tracking and Controlling Inventory 700 500 Xcelpros Team

Introduction to effective inventory management

Especially today, manufacturers, wholesalers and retail businesses from several different industries share several standard business practices, with inventory management at the top of the list.

An efficient, capable inventory management system can distinguish between struggle and success. Any boost to the efficiency of managing your inventory can result in a significant return on investment. To drive the effectiveness of your inventory management, especially when if you’re just getting started, it helps to pay attention to 10 popular techniques:

1.Fine-tune your forecasting Accurate forecasting is a must unless you want to either tie up precious capital in product stuck on warehouse shelves or be unable to meet your customers’ orders.

2.Identify low-turn stock Have a flexible ordering approach that, combined with accurate forecasting, lets to adjust inventory based on customer priorities.

3.Regularly audit your inventory Knowing—not guessing—what you have at any given moment lets you adjust ordering to ensure a balanced inventory.

4.Track stock levels You want to track all inventory from the moment you purchase raw materials or components to when you deliver finished goods to your customer’s door.

5.Keep track of your equipment Especially in a production plant – Knowing what you have, how quickly it wears and when to schedule repairs for optimal life ensures uninterrupted production runs.

6.Verify Quality Ensure all items in your inventory meet your quality control standards, ideally from the moment they arrive.

7.Categorize inventory based on customers needs Ensure you have the most sought-after products in stock at all times, working your way down the line to the least popular products.

8.Consider drop shipping This is much quicker especially for any items you don’t make yourself, especially when it becomes part of your product. An example is a Siemens ® controller for industrial machinery.

9.Rotate your stockTurn your stock so the oldest items are sold first This is especially true for pharmaceutical products with comparatively short shelf lives.

10. Use good inventory management software A viable program that meshes with your financial and sales software helps keep everyone informed, making for happier customers.

Get a consultation on how to track and control inventory in the warehouse.

Book Now

Figure 1:Common inventory management challenges

Common inventory management challenges

Common Inventory Management Challenges

Among the most common inventory management challenges that can affect a number of different businesses are the following:

  • Inconsistent tracking Working with older software that relies on manual data entry opens a company to data entry errors. Mistakes are bound to happen when different departments use different spreadsheets to input the same information.
  • Inaccurate data Companies need to know how much of everything they have on hand and in the pipeline. Without accurate information, you won’t be able to track your production. This can be a massive problem if you’re still manually entering data.
  • Order management Manufacturers often live on the edge of logistics, struggling to make sure deliveries are going out just in time – right before their customers need them.
  • Juggling a complex supply chain Manufacturers need alternate ways of obtaining raw materials and shipping finished products. For example, your primary port is running behind because dock workers are sick. How do you get what you need when you need it?
  • Communications and planning Intercompany communication is critical, especially in a world where companies often have business units in different countries, keeping everyone focused on the same task can be difficult.
  • Robust competition In every industry, competition is ready and willing to grab your customers when you make a mistake or find yourself unable to deliver on time and within budget.

These are a few examples of the challenges faced by modern manufacturers. Thankfully, the good news is that modern ERP solutions can be a huge help when it comes to addressing these issues.

Inventory Management Software As a Solution

Several inventory managements programs available on the market today that focus not only on addressing these challenges, but also by identifying potential issues before they can impact your operations. Some of the best solutions available, like Microsoft Dynamics 365 Supply Chain Management, can seamlessly integrate with your existing software, reducing data silos, allowing different departments to share more information. Instead of requiring three departments to input the same information into a database, each group is able to provide material unique to their specialty.

Effective inventory management programs like Microsoft can print barcodes and QR labels. When these codes are scanned with a hand-held reader or cellphone, users can be rewarded with a wealth of information. The most critical data to track are precisely how much of any product you have, where it’s being stored, and what it will be used for.

For example, you need to produce 20,000 doses of a Covid-19 treatment. Your customer needs them yesterday but will settle for next week. Do you have enough raw materials on hand to meet your customer’s deadline? If not, what can you do to obtain what you need?

Using this information wisely lets management develop complex plans, like the ability to track everything from small lots to pallet loads. A company can learn by checking an item’s progress at different points—its arrival at the warehouse, use in production, loading onto a truck or ship, and delivery to the customer. By examining reports, you can identify potential delays or roadblocks and find ways to speed up delivery.

Supply chain management software on a secure cloud computing platform like Microsoft’s Azure let’s you communicate securely and safely with other researchers, salespeople and vendors. With Azure, you’ll know that your intellectual property and contracts are safe from competitors.

Boost Decision Accuracy with Power BI

With today’s supply chains – seemingly constantly in a state of upheaval – effective inventory management that goes beyond tracking stock on hand is critical to operations. Effectively managing your inventory and raw materials ensures you’ll have the materials you need when you need them. It means having more than one source of supplies and materials. It also means constantly checking with vendors to ensure you have the goods to meet your own delivery deadlines. This is where an integrated business intelligence solution comes into play.

Microsoft Power BI let’s you connect to hundreds of data sources, preparing reports you can easily share. You can confidently deliver interactive messages to customers using information from inside and outside your company. Inventory planners can be warned of potential shortages in time to find alternate supplies. Salespeople can be told of possible delivery delays caused by outside forces, giving them time to ask the customer if they want to use a different shipping method.

Accurate business intelligence at your fingertips puts you ahead of competitors stuck using their “tried and true” methods that are becoming increasingly worthless every day.

Final Thoughts

Effective inventory management comes down to data: knowing what you have and where it is.

A modern inventory control system that supports labels and barcodes lets you track raw materials, work-in-progress and finished goods simultaneously, with high accuracy.

An inventory system with business intelligence helps you find faster and alternate ways of obtaining raw materials and pre-made products, mainly when shipping delays occur. That information can help you get your products to your customers when needed, balancing everyone’s inventory.

Protecting pharmaceutical data with azure banner

Protecting pharmaceutical data with Azure

Protecting pharmaceutical data with Azure 700 500 Xcelpros Team

At a Glance

  • $985 million: The median cost of getting a new drug into the market
  • $1.3 billion: The newer, lower average cost of getting a new drug to market
  • $2.8 billion: The previous average cost of getting a new drug to market
  • $200 billion: The estimated size of the counterfeit drug market
  • 13: the number of new drugs not brought to market each year because of revenue losses from counterfeit drugs

Sources: Wikipedia and Statista.com

Introduction

On average, the cost of bringing a new medicine from idea to market – aka the drug development process – has dropped significantly, from $2.8 billion per drug to $1.3 billion each, according to an online encyclopedia. Counterfeits still have a measurable effect on the number of drugs being brought to market. Recent studies published on Wikipedia and Statista.com show that prescription drug makers continue to get hammered by counterfeit competition.

Statista’s 2022 study provided interesting data on different scenarios showing changes based on market size. The number of new medicines not brought to market ranged from six at $100 billion to 28 at $431 billion

So, what does all this mean? The short version is big pharma and even smaller companies have a considerable investment in intellectual property (IP) they must protect.

IP and Drug Manufacturers

“IP rights, if sufficiently limited, are typically justified as necessary to allow pharmaceutical manufacturers the ability to recoup substantial costs in research and development, including clinical trials and other tests necessary to obtain regulatory approval from the Food and Drug Administration (FDA),” the Congressional Research Service states (CRS).

Pharmaceutical companies are protected by two types of intellectual property (IP): patents, which give exclusive rights to the holder for 20 years, and regulatory exclusivities. According to CRS, these exclusivities range from six months to 12 years, depending on the specific type of drug or biologic.

These companies have a substantial financial investment in their research, development, and testing data. The only way to recover their vast assets is by making and selling products.

It can cost millions of dollars and over ten years of dedication to developing a single drug. With the money levels involved, thieves have a solid incentive to capture this research for themselves.

Protecting Your IP Investment

Take a look at another statistic: $590 million. That’s the amount the U.S. Treasury Department estimates was paid by victims of 450 ransomware attacks in the first half of 2021 alone.

Using that short time frame alone, the Treasury’s Financial Crimes Enforcement Network (FinCEN) stated that “ransomware is an increasing threat to the U.S. financial sector, businesses, and the public.”

Ransomware is one of many cyber-attacks that share a common goal: stealing money. This attack works by infiltrating a company’s computer network and taking control of it. Companies face a difficult decision: pay the ransom, have their data destroyed, or worse, share it worldwide.

Distributed denial of service (DDoS) attacks is another standard weapon in a hacker’s arsenal. “In computing, a denial-of-service attack is a cyber-attack in which the perpetrator seeks to make a machine or network resource unavailable to its intended users by temporarily or indefinitely disrupting services of a host connected to a network,” a Wikipedia article states.

Many of these attacks start with simple phishing schemes. If they get one employee out of thousands to open an infected email, they have a doorway into your data. Microsoft does everything it can to block these attacks and protect its investment and yours.

As with ransomware and other attacks through stealth or brute force, the goal of DDoS attacks is money. The thinking is, “Hit a company badly often enough, and it will pay you to leave them alone.

Figure 1:Key Strategies to avoid cyber security attacks

Key Strategies to avoid cyber security attacks

Book a consultation to discover more about Azure protection in the pharma industry.

Book Now

Protection in the Cloud

Every company has another option, though: investing in its security.

One method of stealing data involves capturing it as it moves from place to place. Microsoft has invested millions of dollars to continuously protect its customers’ data through its Azure cloud computing platform. The company stated in a recent blog post that they detect 1.5 million attempts per day to compromise its systems, spending about $1 billion a year on computer infrastructure security.

With the ongoing need to invest in protecting their on-premise equipment from attacks, more firms are migrating to the cloud, with platforms like Azure gaining importance with each thwarted attack. Moving data from on-premise network servers to widely spread cloud data centers means attackers have to hit moving targets if they want to control a company’s data.

“The cloud has some built-in advantages. Unlike the internet, it was built from the ground up with modern security and privacy in mind. It’s also a controlled ecosystem protected by people who spend all day thinking about data security and privacy,” according to a recent Microsoft online store.

Traditionally, internet and computer security safeguards were bolted onto a tool rather than built into it. “With cloud infrastructure, security considerations are part of the development process,” Microsoft states. “The cloud is an opportunity to do security better,” security analyst Doug Cahill added.

Azure’s status as a cloud platform means that all of the money, and the 3,500 security engineers Microsoft devotes to making it secure, also benefit the software running on top of it. For example, Microsoft Dynamics 365’s Supply Chain Management, which helps companies track raw materials and finished products from the warehouse to the customer, runs on top of Azure.

Companies using this software get the bonus of automatic protection for their cloud data. While these updates can’t directly help prevent thieves from making a physical attack on their buildings, it can make it harder for them to steal data on the move.

“If we detect a set of attacks on one tenant or a handful of tenants, we can synthesize that and start using the things we learn to protect all the other tenants out there,” Bharat Shah, Microsoft’s vice-president of Security for Azure platform, said. “That’s the cloud effect. We learn. We react. We turn something on, and we protect everybody else.”

Azure benefits from Microsoft’s investment in machine learning – a branch of artificial intelligence – to track attempted attacks. Microsoft takes what it learns and uses it to benefit not just Azure but all the companies who’s multi-million-dollar intellectual property investment rides on top of it.

The Bottom Line

Citing the NETSCOUT Threat Intelligence report, Forbes.com estimated 26,000 cyber-attacks per day, or 18 per minute, in 2020 alone. The report indicated that security threats against industrial control systems and operational technology tripled in 2020, while DDoS attacks will grow to 15.4 million by 2023.

These numbers should make any executive who doesn’t have a significant cyber security team on their staff nervous. Thankfully, companies who use Microsoft Azure’s cloud computing platform have the security of more than 3,500 security engineers devoted to protecting it and the data running through it.

With the livelihood of pharmaceutical companies depending on keeping their data safe, secure, and private, you don’t risk your company’s data with poor security. Investing in Azure services today can make a huge difference in your bottom line.

Agility in daily operations using the Power Platform

Agility in daily operations using the Power Platform

Agility in daily operations using the Power Platform 700 500 Xcelpros Team

Introduction

COVID-19 continues to test supply chain and manufacturing operations around the world. More than 18 months after exploding onto the scene, companies still have their hands full dealing with ill workers, limited working hours and uncertain supply chains. Businesses are evaluating how to improve efficiency, lower costs and increase operational performance. The immediate question on everyone’s mind is, “how are we coming out of this crisis?”

While employee safety is a top priority during this pandemic, mitigating the impact on the day-to-day operations is crucial to business leaders. CEOs and CFOs are facing the unprecedented challenge of pivoting product demands and preserving growing cash flow. Implementing a “do more with less” attitude while gaining a few quick wins in the process can build the momentum needed to keep companies moving forward.

Figure: 1 The Ecosystem of an Integrated Supply Chain

The Ecosystem of an Integrated Supply Chain

Pivoting the Plan

The role of the chief information officer (CIO) is critical in risk mitigation strategies. They can draft a plan to determine how the COVID crisis is affecting the company infrastructure short term. The plan must keep operations running smoothly while acknowledging that long term projects and roadmap budgets are affected.

One example is switching employees to remote work while maintaining operations. Software tools like Microsoft Teams and Skype let companies communicate with far-flung workers and managers while the interfaces similar to those in Office 365 programs eases the transition.

Keeping the Lines Open

Not all production and distribution employees work from home even when social distancing and masking restrictions limit face-to-face contact. Many workers are considered essential, causing some factories to switch from a single shift to running 24/7. These facilities are adding shifts and ramping up capacity, working hard to keep warehouses stocked with raw materials and finished products.

Since computer software and machines are now working longer hours, the companies that support them must do the same or risk losing clients.

Figue: 2 Microsoft Power Platform: An Integrated Solution

Microsoft Power Platform: An Integrated Solution

As companies move back and forth between remote and in-person workers, having the right tools in place can help boost communication between production plants and supporting vendors. One example of an effective toolbox is the Microsoft Power Platform. This “low-code, no-code” platform can be installed and running in a matter of hours to generate a quick win. A no-code solution is valuable when needing to make quick decisions while maintaining critical operations.

65%

of all app development will be low code by 2024

Source: Gartner

Get a consultation to learn how to make your daily operations agile using the Power Platform.

Get Started Now

PowerApps are a suite of apps, services, connectors and data platforms providing a rapid application development environment, Microsoft states. “Using Power Apps, you can quickly build custom business apps that connect to your business data stored either in the underlying platform or in various online and on-premises data sources, such as SharePoint, Dynamics 365, Microsoft 365, SQL Server, etc.”

Using custom-built apps connected to internet of things (IoT)-enabled devices, workers gain access and insights into machines that may be headed for trouble. Staff is alerted before shutdowns are required. This lets technicians replace worn parts before production unexpectedly stops.

Power Apps can connect to hundreds of business systems and databases. They make it easy to connect workers with the existing processes and data while working through Microsoft Outlook to keep key staff informed.

Power App benefits include:

1.Greater development agility Automate and simplify repetitive, time-consuming processes to launch faster while reducing errors.

2.Speed and savings Reduce time and cost building web and mobile applications, enabling companies to work through their development project list.

3.Achieve more while doing less Some Power Apps are fully functional out of the box. They have data presets using standard business logic and rules making them fully customizable to individual business needs.

Meeting the Demand

Before the coronavirus, businesses made supply chain forecasts based on the then normal business operations. Now, though, many firms are switching to a demand planning model.

Executives are continually evaluating sales and budget plans. Power Apps let them do it faster. For example, the sales and operations teams can hold “what-if analysis” scenario planning sessions. Using a consumption-driven model boosted by industry and customer knowledge, companies can lower their risk. Similar methods let major carmakers quickly switch their production lines from automotive parts to building ventilators for critical hospital patients and then move back to normal operations when the situation changed.

One such app is Microsoft Power Automate. It automates tedious manual analytic processes when quick decisions are required. Automate provides a creative, cost-effective strategy for businesses to connect their existing legacy systems.

An example is activating workflows for approvals in a matter of hours instead of days.

As workforces become a hybrid of remote and on-site team members, Power Automate can reduce the time spent tracking down approvals and keep things moving.

When companies combine a smaller, leaner workforce with greater demands and less time and then add more government regulations, they increase pressure on managers to make the right decisions quickly or risk falling out of compliance.

Another essential Microsoft Power Platform app is Power Bi, which “bridges the gap between data and decision making.”

The business analytics service delivers insights helping business leaders make fast, informed decisions now and when developing future emergency response plans.

Power Bi:

  • Transforms data into stunning visuals for sharing to any device
  • Exploring and analyzing data in one view
  • Permits sharing customized dashboards and interactive reports

Staying Ahead

In addition to machine maintenance, following federal and state coronavirus guidelines is critical to keeping operations running and employees safe. The Power Platform has several new tools with the pandemic and other emergencies in mind.

  • Crisis Communication- A sample Microsoft Power App taking 20-25 minutes to set up, Crisis Communications combines Microsoft Power Automate, Microsoft Teams and SharePoint. It lets companies coordinate information sharing and team collaboration under evolving conditions. Employees can report work status and make requests. System administrators can use the app to push updates and news including web-based really simple syndication (RSS) feeds from the World Health Organization (WHO), The Centers for Disease Control and Prevention (CDC), local authorities or emergency contacts. The information can go to different locations that are accessible on the web, mobile or in Teams.
  • Power Virtual Agents Crisis Response Bot- The Power Virtual Agents team released instructions to build a Virtual Agent Crisis Response FAQ Bot. The no-code program helps staff get company-specific information they need quickly using a question and answer interface you can embed on your company website.

Power Apps Drives Business Transformation

A recent Forrester Consulting study shows how businesses reduced development costs and increased overall efficiency using Power Apps. Results are for a composite organization based on interviewed customers.

The Total Economic Impact of Power Apps study, March 2020 states:

  • 188% return on investment over three years
  • 74% reduction in app development costs
  • A savings of $4.9 million in application development and management cots
  • Replacing two external applications with a single Power App saved $742,449

Summary

No one knows how long the coronavirus crisis will last. Taking the time to plan how to function in these uncertain times is essential. Using software tools like the Microsoft Power Platform and its many apps will help companies continue to operate in rapidly changing conditions.

Helping your company fit into the-bio-economy banner

Helping Your Company Fit into the Bioeconomy

Helping Your Company Fit into the Bioeconomy 700 500 Xcelpros Team

Introduction

The term “bioeconomy” has begun gaining steam but many executives don’t know what it means or how it might affect their business.

Brain-biotech.com defines bioeconomy as producing renewable biological resources and then converting them plus waste streams into valued-added products. These include food, animal feed, bio-based products and energy, including fuels.

A related but different concept is the circular economy, “where the value of products, materials and resources is maintained in the economy for as long as possible, and the generation of waste minimized,” the article states.

Both concepts share the goals of increasing resource efficiency and lowering demand for new petroleum resources while creating more jobs. Tying into both of these is “cascading,” which promotes recycling and remanufacturing. An example of cascading is using fresh wood to build furniture. When the main product’s life ends, part or all of the wood is used for something else such as a different piece of furniture or a planter.

“The circular economy includes all kinds of material streams with different utilization routes. Organic recycling, which equals biodegradation, and even the capture and utilization of carbon dioxide from industrial processes or the atmosphere are included,” the report states.

One way the bioeconomy affects industry is by producing renewable carbon compared to fossil carbon such as oil and other fossil fuels. The bioeconomy and circular economy have a common goal: creating a more sustainable world with a low carbon footprint. Both avoid using fossil carbon. Using sustainable resources helps achieve climate targets, brain-biotech states.

Among the stated goals of the bioeconomy and the circular economy are:

  • Reducing the use of fossil fuels
  • Wiser management of natural resources
  • Continually reusing minerals, metals, and biomass from agriculture, forests and the seas
  • Creating biodegradable and compostable products
  • Generating ways to capture and reuse carbon dioxide in the Carbon Capture and Utilization (CCU) process
  • Reducing greenhouse gas emissions such as carbon dioxide (CO2)
  • Reducing waste, especially anything going into landfills
  • Promoting research across disciplines and borders
  • Creating more jobs in rural and urban environments

Impacts of the Bioeconomy on the Financial Economy

Features unique to the bioeconomy include creating new products and better utilization of agriculture and forestry, Brain-biotech states. Among its examples are using genome editing to create products with lower toxicity and new functions plus more nature-compatible (i.e., biodegradable) and healthier consumer goods.

So where can we see the bioeconomy? “The U.S. bioeconomy is all around us: new drugs and diagnostics for improved human health, higher-yielding food crops, emerging biofuels to reduce dependence on oil and biobased chemical intermediaries,” the 2012 White House’s National Bioeconomy Blueprint is quoted as saying in youmatter.world.

Youmatter.world connects the bioeconomy and circular economy by referring to the circular economy as “the what” as in what are desired outcomes. The bioeconomy is “the how” as in how biophysical processes can be enhanced to achieve the expected result.

Transforming the U.S. economy from one based on hydrocarbons (i.e., fossil fuels) to a bioeconomy, will have the most dramatic effects. These effects will be felt most strongly in the energy, agricultural, chemical, industrial and consumer products and transportation industries, attorney Neil Belson wrote in 2016.

Among Belson’s conclusions are, “an economy that runs primarily on renewable, domestically produced bio based raw materials is inherently less vulnerable to disruption than one which relies on or is heavily influenced by the availability of foreign fossil fuel energy supplies.”

Among the biofuel resources are corn stalks and wheat straw, animal manure, household and industrial organic wastes containing carbon and dedicated fast-growing energy crops.

Belson also suggests a major target of opportunity is the $164 billion U.S. organic chemical industry.

By the Numbers

After several years of declining revenue caused by low fossil fuel prices, the Organic Chemical Industry is expected to resume growing in 2021, reports from IBISWorld state. Among the highlights are:

  • 13.2%: The 2021 increase in market size estimated by the Organic Chemical Manufacturing Industry (OCMI).
  • $106 billion: The 2021 market size measured by revenue of the OCMI
  • 1,107: Number of organic chemical businesses in the US
  • 75,441: Number of people employed in the organic chemical businesses in the US

Current top products and related manufacturing activities are producing:

  • Ethyl alcohol
  • Cyclic crudes, coal tar, wood chemical and intermediate products
  • Basic organic chemical products
  • Fatty acids
  • Synthetic organic alcohols
  • Synthetic flavor and perfume materials
  • Bulk pesticides

This list does not include forestry-related materials such as major wood products.

According to the Government

The US Department of Agriculture released the 128-page “An Economic Impact Analysis of the U.S. Biobased Products Industry” in 2015.

Using 2013 numbers, the US Biobased Products Industry:

  • Contributed 4 million jobs
  • Added $369 billion to the U.S. economy
  • Created 1.64 more jobs for every 1 biobased products job
  • 20,000 products in the BioPreferred program database not including traditional textile fabrics or forest products. The true number is closer to 40,000, the report states.
  • 300 million gallons of petroleum replaced by biochemicals and natural-based products replacing petroleum products such as Styrofoam.

Get a consultation to learn how to get your company ready for the bioeconomy.

Get Started

Areas of Opportunity

Figure: 1Number of Installed Ethanol Biorefineries in the US

Number of Installed Ethanol biorefineries in the US

Statista states that in 2019, the US had more than 200 ethanol biorefineries. In 2015, the USDA listed 213 such refineries. Audi, BMW, Porsche and Volkswagen make diesel vehicles that can use biodiesel blends, edmunds.com states. As of 2014, most biofuel came from soybean oil. The US Department of Energy states that the B20 biodiesel blend contains 2% – 6% biodiesel mixed with petroleum fuel.

Adding biodiesel improves fuel lubricity making vehicles easier to start and reduces ignition delay. It also reduces premature wear on moving parts even in concentrations as low as 1%, the Alternative Fuels Data Center states.

Chemical and pharmaceutical companies, take note: Modor Intelligence estimates the market for biochemical reagents will grow at a CAGR rate of 9.1% between 2020 – 2025. This market is defined by products such as cell and tissue reagents, electrophoresis and others plus geography. Asia Pacific is the fastest growing market while North America is the largest.

Chromatography reagents have the greatest demand with their use in many pharmaceutical processes such as separating chemicals and biomolecules, diagnostics and protein purification.

Market Research Future’s report on the Global Bio-Based Chemicals Market states the top products between 2019 – 2025 will be bioplastics, bio-lubricants, bio-solvents, bio-based acids, bio-surfactants, bio-alcohols and others.

Let Technology Help

What chemical wastes currently costing the company money to be shipped to a landfill can be reused to boost profits? Companies using technology like Microsoft PowerBi and Microsoft Dynamics 365 to organize their data can organize waste into its core components. Some of it might be easily converted into biofuels. Others might be broken apart with components becoming biodegradable solvents.

Another way tech can help is by looking at existing customers in growing markets and suppliers in areas where key crops are grown. Are they ways to piggyback shipments and reduce transportation costs while also cutting air pollution? Microsoft Dynamics 365 Supply Chain Management can combine and crunch data. While helping a business run much more efficiently, it can also offer insights into new ways to use existing products.

The Bottom Line

The bioeconomy is here to stay, as is global warming. Companies entering bioeconomy markets should look at new ways to use plant-based materials to replace petroleum products, like the chemical and pharmaceutical industries using plant-based solvents to develop new medicines because they are less toxic and better for everyone in the long run.

Alternate fuels, fibers, chemicals made from plants and other biological sources are just a few of the many potential products whose demand will continue to rise.

Using cutting-edge enterprise resource planning software can help a company more accurately evaluate its own products and resources. Who knows, there just might be the materials to build some bioeconomy products already sitting on a warehouse shelf. With the right tech, you will know what you have.