

Chemical manufacturing is a complex process with several different variables to consider at any given moment. Staying ahead of the competition today means using technology to help drive productivity and profitability.
Advanced analytics features in Power BI supply valuable insights into the substantial amounts of data that enable chemical manufacturers to make more informed decisions and optimize their operations.
In this blog post, we’ll explore how advanced analytics in Power BI can help chemical manufacturers drive productivity and profitability, including how data-driven decisions can be used to improve performance, reduce costs, and create more value for the business.
Power BI and the benefits of Advanced Analytics
In the chemical industry, data-driven decisions are necessary for businesses looking to maintain a certain level of efficiency and profitability. This means that organizations need access to reliable analytics and insights from their data to make strategic decisions that lead to better outcomes. Advanced analytics in Power BI are powerful tools that can help chemical companies maximize their productivity and profitability.
Advanced analytics solutions offer various features designed to help chemical companies find trends, uncover hidden patterns, and predict future events. Using the latest AI-based algorithms, these advanced analytics solutions can uncover insights that would otherwise be impossible to discover, resulting in improved decision-making and more efficient operations.
Power BI is an analytics tool that provides an interactive platform for visualizing and slicing data. Included features like charts, graphs, and dashboards allow users to easily explore and analyze data from anywhere, making it easy to gain a comprehensive understanding of their data and make more informed decisions.
Figure 1:Benefits of Advanced Analytics in Power BI
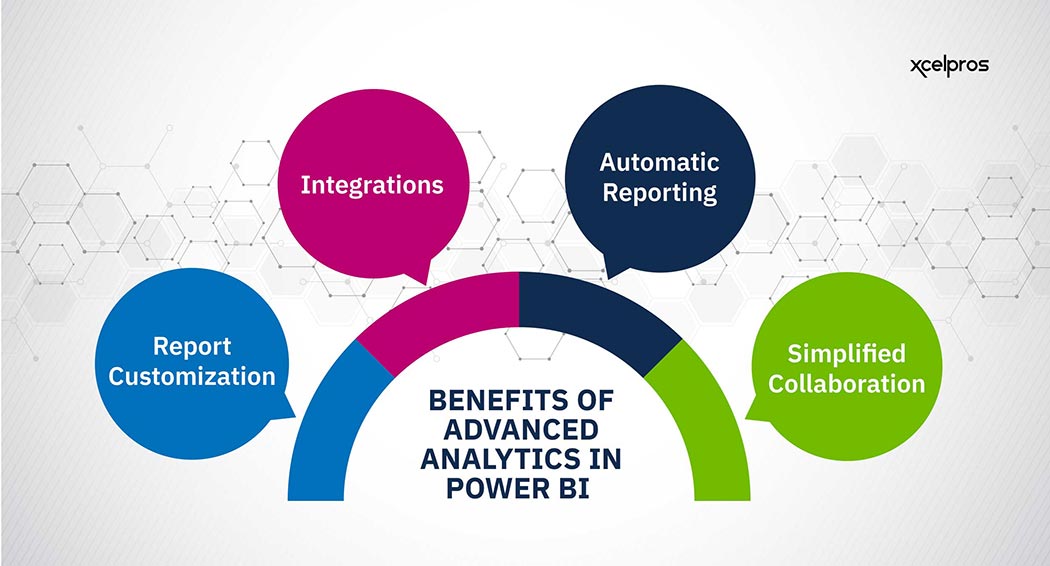
Integrations
Power BI is a powerful business intelligence tool that can integrate with various systems, including enterprise resource planning (ERP), customer relationship management (CRM), financials, and more. These integrations make connecting data across different platforms easier, ensuring that all stakeholders have access to the information they need to make decisions quickly and accurately.
For businesses in the chemical industry, Power BI integrations can be incredibly useful for businesses in the chemical industry. They allow companies to make better use of their data and get insights from multiple sources. An ERP integration can help track inventory and orders, while a CRM integration can offer information about customer preferences and buying habits. By connecting these different systems, businesses can better understand their market and customers.
In addition, Power BI integrations can be used to improve operational efficiency. By integrating various systems, such as enterprise asset management (EAM) and predictive maintenance systems, businesses can get real-time insights into their equipment’s performance. This can help them find potential problems before they become major issues and ensure that their operations run smoothly.
Overall, Power BI integrations can be invaluable for businesses in the chemical industry. By connecting multiple systems, they can gain better insights into their operations and customers, improve operational efficiency, and ensure compliance with regulatory requirements. With Power BI, businesses can make better use of their data.
Industry reports, such as Kearney’s digital transformation framework for chemical manufacturing, emphasize that integrated data ecosystems – linking ERP, CRM, and MES – are key to enabling agile decision-making and operational transparency.
Automatic Reporting
Power BI supports automated reporting to help show trends and improve productivity. This automation allows companies to quickly find problems or opportunities within their processes and operations, which helps them make informed decisions quickly and efficiently.
With automated reporting capabilities, businesses in the chemical industry can save time by automating data collection and reporting processes. They can also receive help from the insights generated by this process, allowing them to make smarter decisions in less time. With accurate and up-to-date data, businesses can measure performance, compare trends, and optimize operations more effectively.
Overall, automatic reporting with Power BI helps businesses in the chemical industry achieve greater efficiency, profitability, and customer satisfaction.
Report Customization
Power BI gives businesses several ways to customize reports to meet the needs of any business, including those in the chemical industry. Businesses can quickly and easily customize their reports to streamline the entire process. This includes creating personalized visualizations, adjusting the format and layout of data, and adding new elements to existing reports.
Customized reports can give these businesses key data points to check progress, performance, and safety. Reports can be tailored to track specific aspects of a business’s operations and production, allowing for more efficient and effective decision-making. The customization process is highly intuitive and provides users with an interactive dashboard for creating and editing reports.
Overall, report customization provides businesses in the chemical industry with the tools they need to stay ahead of their competitors and maximize their value in the market. With custom reports, companies can easily identify trends and make better decisions faster, increasing productivity and profitability.
Simplified Collaboration
Power BI was designed from the start to promote collaboration and communication across teams in the chemical manufacturing industry, simplifying data sharing and streamlining how different departments and locations work together to achieve their objectives.
One of the main benefits of Power BI is that it helps users break down data silos. By allowing users to pull from multiple sources, such as cloud-based databases and on-premises sources, Power BI enables users to get a comprehensive view of their data. This helps decision-makers in the chemical manufacturing industry better understand the relationships between different pieces of data, which can then inform more informed decisions.
Power BI also makes it easier to access and share data with others within the organization. Through built-in visualizations, users can easily create a dashboard of all the data they need to review, making it easier to collaborate on data-driven decisions. Power BI also offers custom security settings, allowing users to control who can view, edit, and access the data. This ensures that sensitive data stays secure and private while allowing users to collaborate on projects.
Power BI’s collaborative features make it an invaluable tool for the chemical manufacturing industry. By eliminating data silos, users can access a single source of truth that can be shared with anyone in the organization. Additionally, its ability to restrict access to certain data and its customizable security settings help keep confidential information safe. Finally, its built-in visualizations help make it easier for everyone involved in a project to collaborate on data-driven decisions.
Predictive Maintenance, Throughput Analytics, and Maximizing Value
Chemical manufacturing is an incredibly complex industry with many operations and processes. Fortunately, advanced analytics and Power BI can help chemical producers make data-driven decisions and optimize their production, maintenance, and supply chain operations. Three advanced key analytics–based tools can help chemical producers improve their performance: predictive maintenance, throughput analytics, and maximizing Value.
Predictive maintenance is one of the most effective ways to ensure the best performance of chemical manufacturing assets. This tool uses machine learning algorithms to identify patterns in equipment behavior and predict potential failures before they occur. Predictive maintenance also helps to minimize downtime by enabling initiative-taking maintenance actions. This approach can increase operational efficiency and reduce costs associated with unexpected equipment breakdowns.
Throughput analytics are essential for optimizing production operations in chemical manufacturing. By analyzing production data, chemical producers can gain insights into their processes’ efficiency, find improvement opportunities, and reduce waste and inefficiency. Yield analytics can decide how effectively raw materials are being converted into finished products, while energy analytics helps producers identify areas of excessive energy consumption. Finally, throughput analytics enables chemical producers to optimize their production schedules by tracking the performance of each stage of the process.
Maximizing Value is important for enhancing the profitability of chemical producers’ supply chains. Power BI uses advanced tools to analyze customer data and uncover valuable insights that can be used to create new products and services that meet customer needs. Value maximization can also help chemical producers find opportunities to reduce costs in their supply chains by streamlining processes, finding more cost-effective sources of raw materials, and improving planning operations.
Next Steps
As with any technology solution, getting the most out of Power BI for your chemical manufacturing business requires a solid implementation plan. To ensure success, best practices for implementing Power BI at a chemical company should include these steps:
- Gathering requirements from key stakeholders to find specific data needs and business goals.
- Designing an analytics solution tailored to the organization’s unique business and data environment.
- Developing an end-user interface that is intuitive and easy to use.
- Training users on how to get the most out of their Power BI data.
- Testing and refining the system to ensure it meets the needs of all stakeholders.
If you are ready to take the next step in using advanced analytics and Power BI to improve productivity and profitability in your chemical manufacturing business, contact us to learn more.
Schedule a call, our experienced team can help you design, implement, and support a custom solution tailored to your requirements. With the right analytics solutions, you can drive performance while getting the insights you need to stay competitive in today’s changing markets.